Optimising Core Web Vitals on SPAs
Approximately 40% of my clients have single-page applications (SPAs), and approximately 100% of my clients care about core web vitals - the key performance metrics which impact Google search ranking.
Consistently measuring performance of every website and framework is an impossible task, so the core web vitals (largest contentful paint, first input delay and cumulative layout shift) are lowest common denominator metrics. This means that they have been designed to work almost everywhere, but one of the most important aspects of SPAs is missing: route changes (aka in-app navigations).
The core web vital metrics were designed to be better proxies of user experience, but we need to be mindful of how they apply to SPAs. There are more details on the core web vitals in this post, but in summary:
- LCP, FID, FCP, TTFB, TBT and TTI - only measured on session landing pages
- CLS (& Responsiveness) - measured throughout a session, the highest / worst value is collected and attributed to the landing page URL
Largest Contentful Paint
LCP is my favourite web performance metric; it captures a simple event in a web experience — when the biggest thing is painted to screen — and envelopes all sorts of important elements of the page load such as time to first byte, document size, blocking JS and CSS.
Only the first landing page in a session will generate LCP values on SPA sites. The specification calls for LCP capture to start at a navigation event and stop after the first user interaction. Route-changes / in-app navigations occur after an interaction and thus are not captured by Chrome for the CrUX dataset.
LCP is captured for every individual page load with MPAs / traditional web apps. This means that mid-session visitors will likely generate fast LCP values due to having a warm cache and connection - and if your average session length is greater than 4.0 this will probably result in a faster 75th percentile value. As LCP is only captured on landing pages for SPAs, the results are biased towards the worst case experience of an empty cache. This potentially means that for two identical sites, the SPA will report worse LCP values.
Whilst mid-session experiences are certainly important for UX, we should focus primarily on landing pages to optimise for Google's core web vitals. This means that we should do everything to reduce the critical path to LCP on a first-view. These first experiences are also crucial to improve user experience and reduce bounce rates!
Unfortunately most SPA frameworks don't make this easy out of the box. E.g. if your product image is defined in data then the image element won't even by injected into the DOM until the application JavaScript has downloaded, parsed and executed. This can lead to late asset discovery and correspondingly poor LCP values.
Server-side rendering (SSR) is key here: first-views should deliver the page as HTML and allow the browser to apply its optimisations to download content in the correct order. Just ensure that hydration doesn't cause reflow!
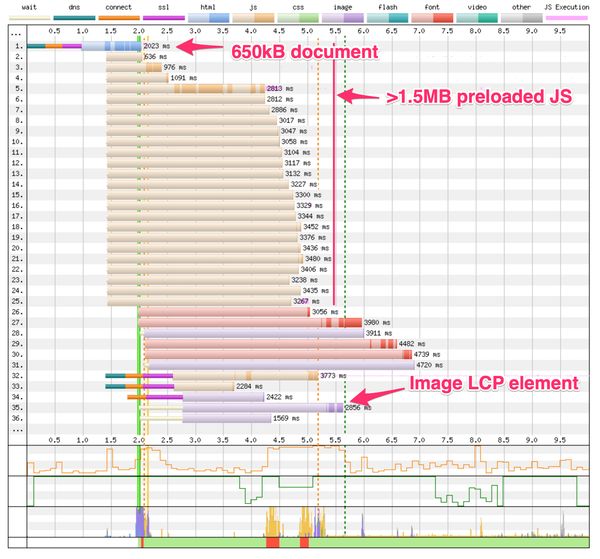
SSR alone won't save us though. The example waterfall chart below shows an SSRd SPA landing page with some common performance anti-patterns: a very large HTML document and a large amount of preloaded JavaScript assets. Note how these delay the download of the image on line 35, which is the LCP element for this page (LCP is marked as the vertical dashed green line at 5.6s).

I've previously written some advice on optimising for LCP which is a good place to start. Note that LCP varies by viewport (e.g. a hero image on mobile might be smaller than your heading text element on desktop). Another LCP nuance is that cookie consent banners may be your LCP element for first-time visitors, so make sure to test and optimise for multiple user states! Harry Roberts has written up a great summary of the gotchas with LCP.
Cumulative Layout Shift
CLS is my second-favourite web performance metric; it captures the previously intangible feeling of a page being unstable — how much content moves around when you aren't expecting it.
Unlike LCP, CLS can be captured throughout a user's session on a SPA. Unexpected layout shifts are accumulated in clusters: if three shifts of 0.1 occur within one second then your CLS score would be 0.3. CLS clusters close after one second of inactivity or after a maximum of five seconds; importantly this process occurs throughout a user's session on your SPA and the largest CLS score by the end of the session is attributed to the session landing page.
This attribution issue means that identifying causes of layout shifts can be difficult. If you see high CLS reports in Google Search Console they will be logged against the session landing page, but could have occurred at any point in the user's session.
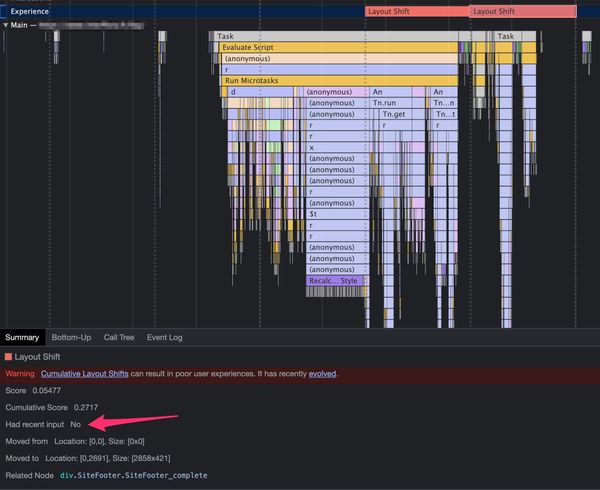
CLS has some further nuances: layout shifts are only unexpected (and thus count towards CLS) if they are not preceded by a discrete user interaction (click, tap or keypress) within 500ms. This can mean that users on slow network connections report a higher CLS: if for example your search API normally responds in under 500ms from a button press, the subsequent layout shifts are expected. In scenarios where the search API takes longer than 500ms, the layout shifts caused by rendering the results will exceed the 500ms threshold and thus become unexpected. I call these un-unexpected layout shifts, and on SPAs they can have a significant impact when route changes take longer than half a second.

Another nuance in the expectedness of layout shifts is the user input types: scrolls do not (currently) count as a discrete user input, so any layout shifts on scroll will count towards CLS scores - thus it is important to have width and height attributes on lazy-loaded images! Also beware of lazy-loaded components, Simon Wicki has a great blog post on this topic.
These nuances mean that optimising for CLS on your SPA is more complex than it may seem at first. I suggest three separate areas of focus:
- Reduce frequency and size of layout shifts on first-view (easy)
- Remove layout shifts that occur on scroll (moderate)
- Investigate potential un-unexpected layout shifts (tricky)
This process (especially for 2. and 3.) is manual and time consuming. Where possible, collect web vitals metrics from your route changes using the web-vitals JS library or a RUM solution like Akamai mPulse to help identify the layout shifts that your users are experiencing, attributed to the correct URL.
First Input Delay
FID is one of my least favourite web performance metrics — I have yet to work with a client where their FID numbers showed anything of interest. That said, FID is theoretically a bigger issue on SPAs than MPAs.
FID measures the delay between the first user interaction with your page and the browser being able to respond to it. Basically it represents how likely it is that a user is unlucky and tries to interact with the page whilst a long task is consuming the browser main thread.
The reason I say that FID is more important to SPAs than MPAs is simply due to the reliance on JavaScript for rendering or hydrating pages. Whether your application is client-side rendered or SSRd, there will be a significant chunk of JavaScript execution during the page load to set the page up. FID values on SPAs are biased towards the worst part of the experience as FID is only captured on the landing page.
Optimising FID itself is nearly impossible: the values vary by the visitor's device and the relative timing of their interaction. Instead, focus on reducing total blocking time (TBT). TBT is effectively the sum of long tasks during a page load: a high value indicates that it is more likely that users will try to interact during a long task and thus have a high FID.
You can theoretically improve FID by discouraging interaction until JavaScript execution has completed. I have seen this in practice on some very heavy SPAs (e.g. interactive gaming & gambling) where a splash screen is shown until the application is completely ready. Whilst this will improve FID, it could well degrade LCP, introduce splash-screen SEO penalties and certainly won't have a positive effect on user experience.
Back to TBT — there are four key ways to reduce the impact of long tasks and positively impact FID:
- Remove expensive JavaScript (still using moment.js?!)
- Choreograph long tasks to occur when users are less likely to interact
- Reduce long tasks by breaking expensive functions into chunks (see requestIdleCallback for a future option here)
- Remove all synchronous API calls
To find long tasks: set CPU and Network throttling then record a performance profile of a page load. Look for long tasks in the profile and tackle them from longest to shortest. The example below is an innocuous task which depends on a synchronous XHR - it may not even appear as a long task without network throttling!

Bonus: Responsiveness
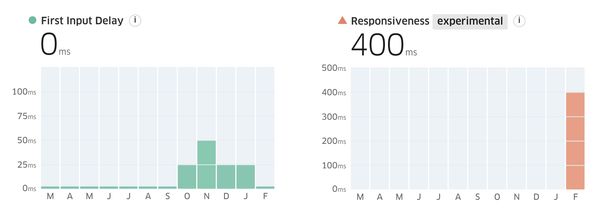
Responsiveness is a new web vital being tested by Google. First input delay has received some negative feedback due to being difficult to optimise for and hard to understand. Another issue with FID is that almost all sites (100% of desktop and 90% of mobile) pass the FID assessment, meaning it is not actionable for most site owners.
Responsiveness is a potential replacement for FID, and in my clients it often shows a failing result where FID passes. For example a SPA website I'm currently working on:

The boundaries for good / needs improvement / poor are currently the same as FID: <100ms / <300ms / ≥300ms respectively.
My concern for responsiveness on SPAs is that this new metric captures the full interaction. FID only measures the time the browser takes to register a user input, whilst responsiveness measures the end-to-end interaction latency; this potentially includes the client-side processing to respond to the user's input and paint the next frame on screen. For SPAs this could include the logic to execute a route change which can often be an expensive process. The metric may in the future also consider scroll events (currently ignored for FID) which could reflect negatively on infinite-scrollers or lazy loaded components.
If your responsiveness value is currently high (I love Treo for quickly seeing CrUX data), this indicates that user interactions on your site may feel slow. The metric itself is still in flux and won't be impacting the page ranking SEO factor for a reasonable time — Google has said that there will be a six month warning before any changes to the core web vitals are pushed live — but it still makes sense to monitor and optimise for responsiveness.
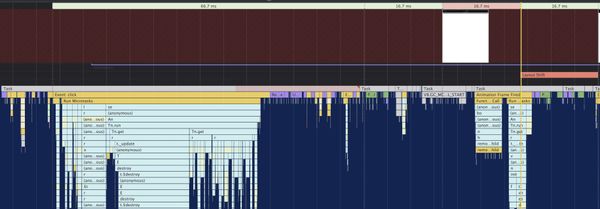
A quick method to determine where a high responsiveness value comes from is to record a profile during an interaction. I use Chrome developer tools for this: load a landing page, then hit record in the performance tab and make an interaction. Look for any delays to rendering the first frame after the interaction and focus your optimisation efforts there. In this case, a click triggers a route change which takes a little over 100ms from the first interaction event to the first frame painted to screen:

To reduce the reported responsiveness value we need to review the long task, the multiple style recalculations and garbage collection event.
In Summary
Core web vitals are useful metrics, and important to optimise for. If you run a SPA focus initially on landing page experiences: these are important not only for the page experience ranking factor but also to reduce bounce rate and improve UX.
Don't be dismayed if you have odd results with cumulative layout shift appearing in Google Search Console. Fixing layout shifts is often easy, as long as you can find them! Record a performance timeline whilst navigating your application in multiple device profiles (at least phone, tablet & desktop) and look for unexpected layout shifts with high scores, I tend to focus on any shift with a score of over 0.05.
If you are still struggling to get your core web vitals into the green, feel free to reach out to me for further advice.