How to Improve Core Web Vitals
10 Nov update: Google has announced that the Page Experience update will go live in May 2021!
Introduction
Google announced updates to the Page Experience ranking algorithm in May of 2020. This update includes two key highlights:
- Three new performance metrics will be used as ranking signals for SEO
- Top Stories no longer requires an AMPHTML page, and performance will become a ranking factor
The update is great news for site speed fans: Google is putting an even greater emphasis on the speed of user experiences, offering two SEO benefits to site owners who deliver the fast experiences that customers expect.
The Page Experience Update was delayed due to COVID-19. Changes to the ranking algorithm will happen in May 2021
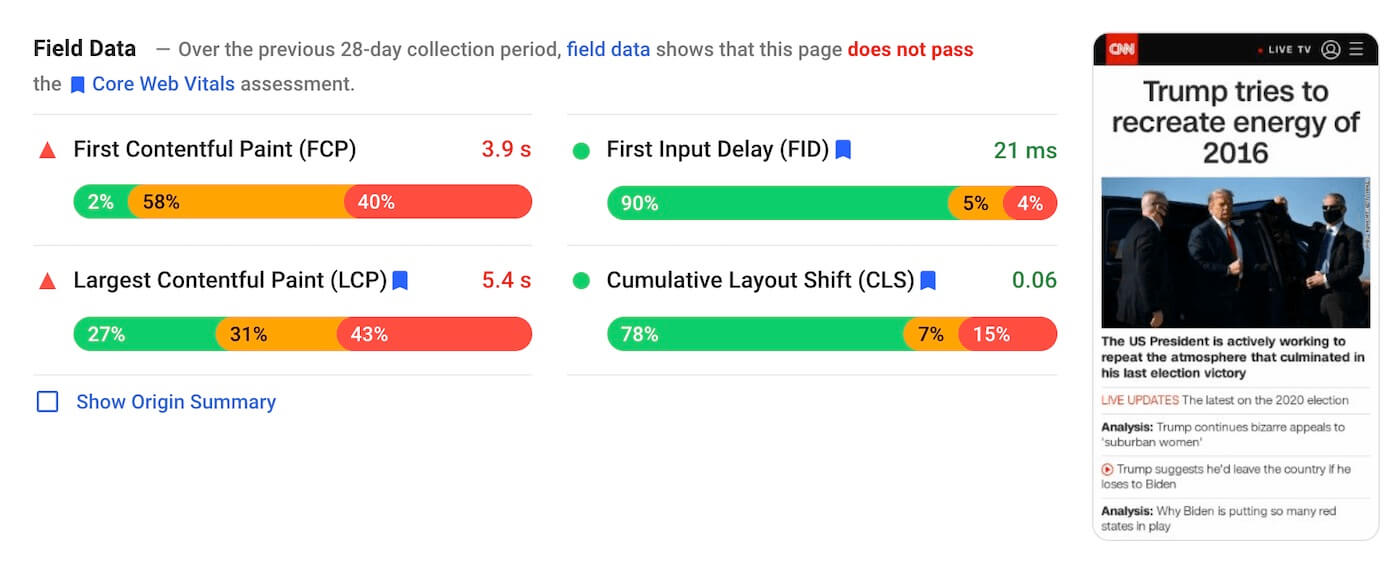
To get a feel for your current performance against these metrics, try running a page through PageSpeed Insights or web.dev/measure. These Google tools will give you a score for performance and let you know how a page measures up against the new performance goals.
These performance metrics have been designed to be universal measures of page speed and to be good proxies for perceived user experience, they should be valid measures of how the experience feels for almost all web pages. That said, Google has stated that these metrics are being reviewed constantly and may change in the future.


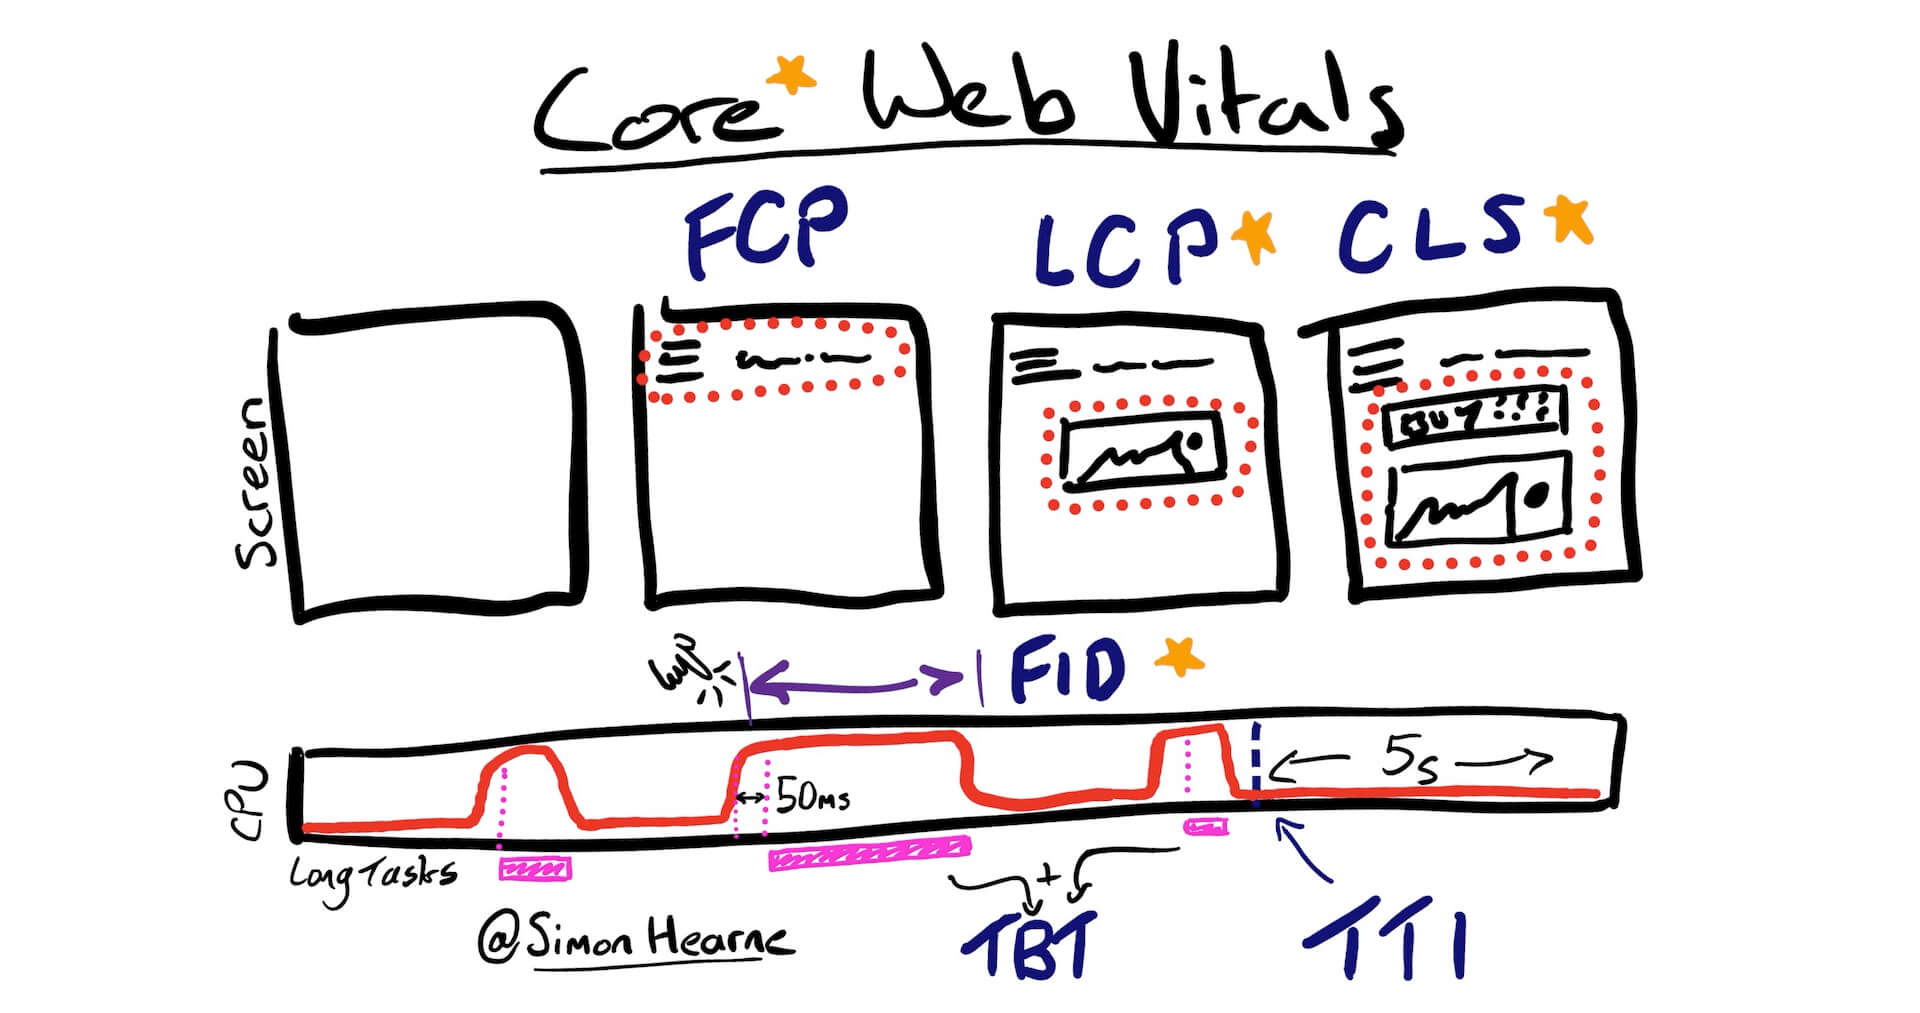
Largest Contentful Paint is a measure of rendering performance, a good replacement for page load time or DOM content ready.
First Input Delay is a measure of how long it takes the browser to respond to discrete user input like clicks or taps.
Cumulative Layout Shift is a measure of how unstable the page was, a sum of all unexpected layout shifts in the page lifecycle.
The recommended values above are determined from the 75th percentile from real user experiences: at least 75% of your page views should exceed the Good value to pass this assessment!
Improving your core web vitals will potentially have a positive impact on SEO ranking, it will definitely have a positive impact on user experience!
How Google Measures Speed
The three new performance metrics are relatively new to the world of web performance, as such they are currently only supported via API in Blink-based browsers (Chrome, Chrome on Android, Chromium Edge). The data that Google will use for the Page Experience update is taken from Chrome UX Report (CrUX), a collection of anonymised performance statistics taken from real page loads in Chrome browsers around the world. CrUX measures all regular page loads, for both landing and mid-session pages, regardless of cache state. It does not measure soft navigations (route changes) within single page applications.
This means that soft navigations will potentially be penalised, with higher than expected CLS scores and missing or unfairly high LCP values. Unfortunately there is not yet a good solution to this problem. This makes it even more important to reduce unexpected layout shifts and optimise LCP as much as possible!
So SPA landing pages will be penalised as CLS is summed throughout the whole session (and attributed to landing URL).
— Simon Hearne (@simonhearne) October 15, 2020
SPA soft navs will be further penalised as LCP is only calculated on hard navigations (so no data or slow data, depending on app).
Unless I'm misunderstanding?
The update comes with a set of recommended speed goals, these are measured at the 75th percentile in the CrUX data so at least 75% of the measured experiences should meet or exceed these goals. The cache and session status are not available in the CrUX dataset so the 75th percentile value is taken from all page loads, cached or not.
PageSpeed Insights will give you three sets of performance metrics, where available:
- Field - the data from CrUX for the given URL
- Origin summary - the aggregate field data of all of your pages
- Lab - a test run from a Google server which applies throttling
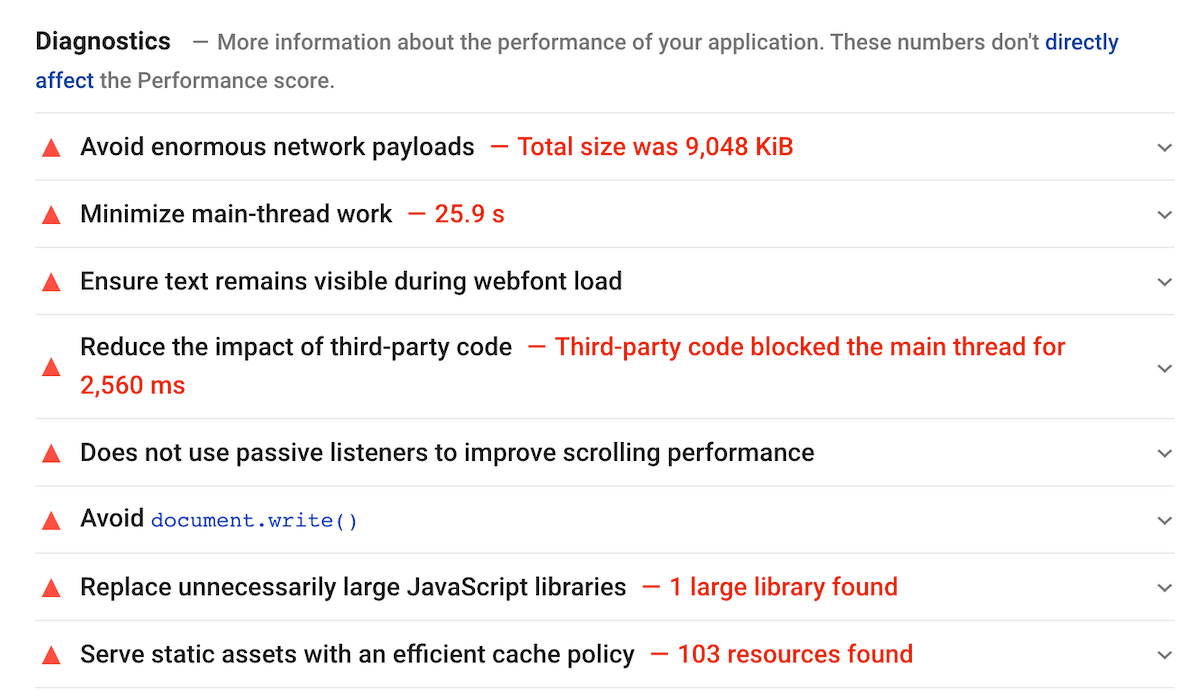
If your page does not have enough traffic to produce the Field data you will only get the origin summary result. Recommendations and diagnostics in PageSpeed Insights are produced from the Lab test, performance metrics should be taken from the field results. The recommendations should give you a general idea of areas for improvement which will positively impact your web vital results.
Optimising for Core Web Vitals
Let's talk about how to measure, diagnose and improve each of the three new metrics: LCP, FID and CLS, in turn. Remember that any optimisations to improve these metrics will almost certainly make your pages feel faster and improve user experience!
Largest Contentful Paint (LCP)
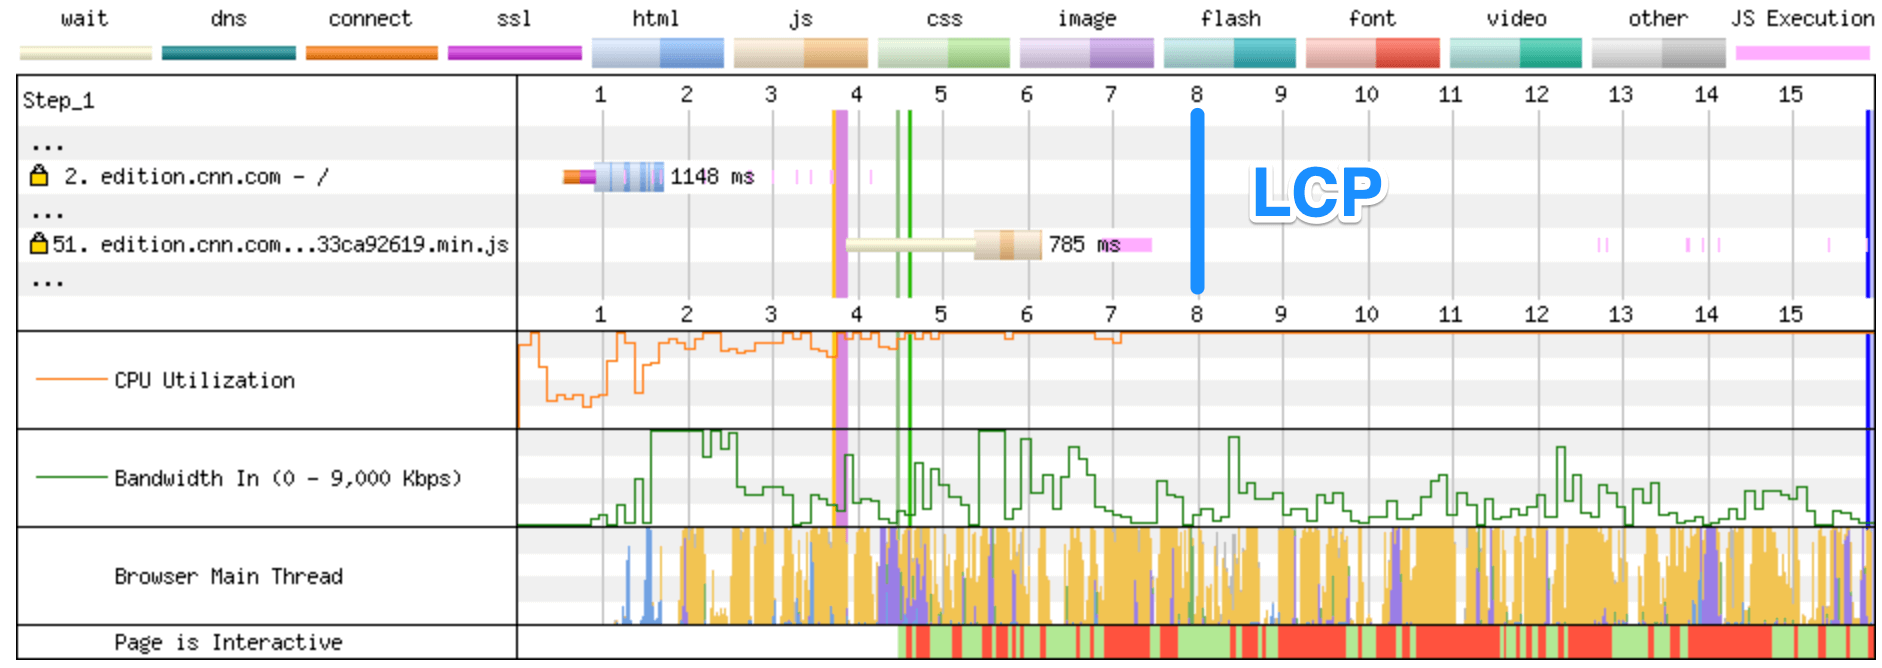
LCP is a timing point measured when the largest above-the-fold element is painted to the screen. In most cases this will be either a hero image / video, or the main block of text on the page.
LCP is a good alternative to "Page Load Time": it measures everything required for your site to render the key content on a page - DNS, TLS, HTML, CSS and blocking JavaScript, but does not include asynchronous scripts or lazy-loaded content.
LCP occurs only after three stages of page load have completed:
- HTML delivered and parsed
- Critical path assets downloaded, parsed and processed
- LCP asset downloaded and rendered (image, video, web font etc.)
Delivering fast documents is one of the most important things you can do to improve page speed, if you can reduce this by 100ms then every other duration metric will get 100ms faster! Fast document delivery comes down to a few key optimisations:
- DNS - DNS is the address book of the internet. Optimise DNS by increasing TTL and using a globally distributed DNS service (See this blog post for more detail).
- TCP - The constraining factor in establishing a TCP connection is (normally) the round-trip time between user and server. Use a content delivery network to bring this as low as possible.
- TLS - Secure websites require one or more additional round-trips to create a secure connection. Ensure you have OCSP stapling enabled on the site's certificate (maybe even downgrade from EV to OV to achieve this!) and that your server or CDN is configured for TLSv1.3 support (see Is TLS Fast Yet?).
- TTFB - The time to first byte for your website is constrained by how fast the server can create the response. If possible, this should be cached in a CDN or reverse proxy. If HTML caching is not possible (for example if there is personalisation in the page), ensure that your server environment is able to deliver pages within 100ms.
- HTML - It may sound obvious, but the size and structure of your HTML document is critical to performance. Ensure that the HTML document is compressed and under 50kB over the network. Pay attention to the
<head>of the document to ensure that the<title>is first and that there are no blocking third-party<script>tags here.
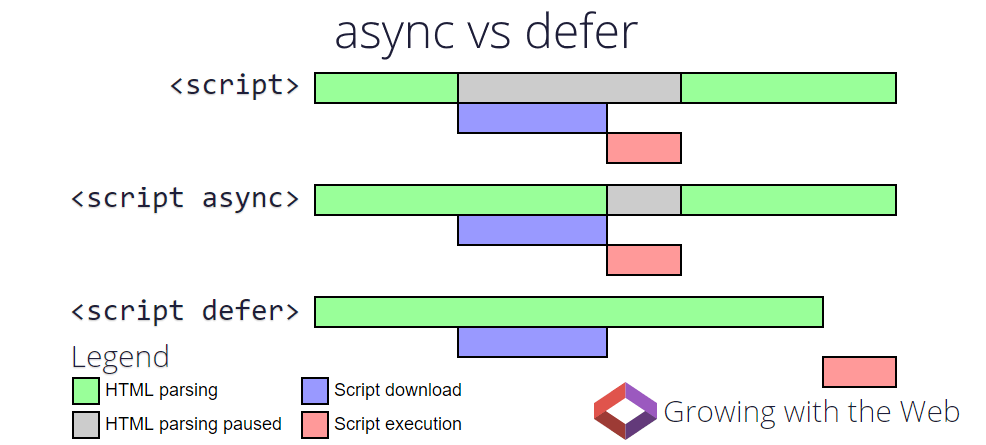
Once the HTML is downloaded, the browser parses the document line-by-line to find resources in the critical path. CSS and JavaScript in the head are given very high priority, then images in the body are downloaded in the order they appear. If the browser parser sees a blocking script tag (i.e. no async or defer attribute) it will stop everything it is doing while fetching, parsing and executing that script. As such, scripts should always be either async, when order of execution is not important, or deferred when order of execution is important. It also makes sense to review inline scripts to reduce their impact.
Where possible, split your JavaScript bundle by page and by modern JavaScript support. This will allow you to send the smallest possible bundle and use modern technologies where supported. Note that module has a defer behaviour by default:
<script type="module" src="/app-homepage.esm.js"></script>
<script nomodule src="/app-homepage.js"></script>
The next step in the critical path is loading stylesheets: without CSS the browser does not know how to render the page so it will block render on any <link rel="stylesheet"> tags. Ensure that CSS is bundled by page to reduce unnecessary weight, you can fetch and cache a full stylesheet later in the page lifecycle using the media="none" hack (ensuring that this file won't cause a layout shift!):
<link rel="stylesheet"
      href="lazy.css"
      media="none" onload="this.media='all'" >
LCP is measured independent of cache state, so ensure your static assets (JavaScript, CSS, images and fonts) can be cached in the browser for at least am hour with a response header like cache-control: max-age: 3600. Also make sure your text assets are compressed with gzip or brotli!
A common issue I see, especially on ecommerce sites, is a large number of non-critical images that load early in the page, such as in a mega menu definition. Native lazy-loading is a great technique to optimise LCP by reducing bandwidth contention during page load. The loading attribute is not yet supported in Safari, but it is in WebKit and currently available in iOS Safari behind a flag, so we can expect general support soon! It is supported in all browsers which send data to CrUX, so implement now to benefit the data which will drive the Page Experience SEO update.
<img src="menu-img.jpg" alt="..."
      width="200" height="200"
      loading="lazy" >

<img src="hero-img.jpg" alt="..."
      width="1024" height="600"
      loading="eager" >
Ensure your hero element has a loading='eager' attribute and that images below the fold or hidden by default have a loading='lazy' attribute. This simple optimisation allows the browser to give priority to downloading important assets sooner, improving LCP and user experience. Read more on web.dev.
It should go without saying, but if your hero element is an image or a video then it should be delivered in the most optimised format for the browser. This may mean that a third-party service like Cloudinary or Akamai Image and Video Manager is a good option to dynamically optimise your media content.
The hero element should not be JavaScript-bound, so image carousels and embedded video players are best replaced with static images and native <video> elements with an appropriate poster image attribute. If you have a video poster, make sure that it is optimised and use a valid preload attribute like none or metadata to reduce bandwidth contention during page load. Read more about these optimisations on Mozilla Developer Network.
A rule of thumb is that a hero image should not be larger than 200kB.
First Input Delay (FID)
FID is a measure of how long the browser was busy with other tasks before it could react to a discrete user input event like a tap or click. This is an indication of how responsive the UI feels to a user, and how busy the CPU is with JavaScript processing.
The only consistent way to improve FID without degrading the user experience is to reduce the time spent executing JavaScript, both in the page load and during the page lifecycle. A simple way to game this metric would be to hide your content (perhaps behind a loading screen / spinner) until your JavaScript has completed executing, so your visitors don't try to interact before your app is completely ready. This will most probably negatively impact your LCP and CLS metrics though, so tread with caution!
Assuming we're trying to improve FID and improve visual performance, we only have a few options:
- Delay or remove third-parties
- Defer non-critical scripts
- Improve JS performance
The first task is to run a performance trace on a key page to see where the main thread time is consumed. Any big chunks are cause for concern and should be investigated.
Focus on long tasks, these are singular blocks of execution which are most likely to cause high first input delays. Click on a long task to reveal the call stack in the "Bottom-Up" tab below:
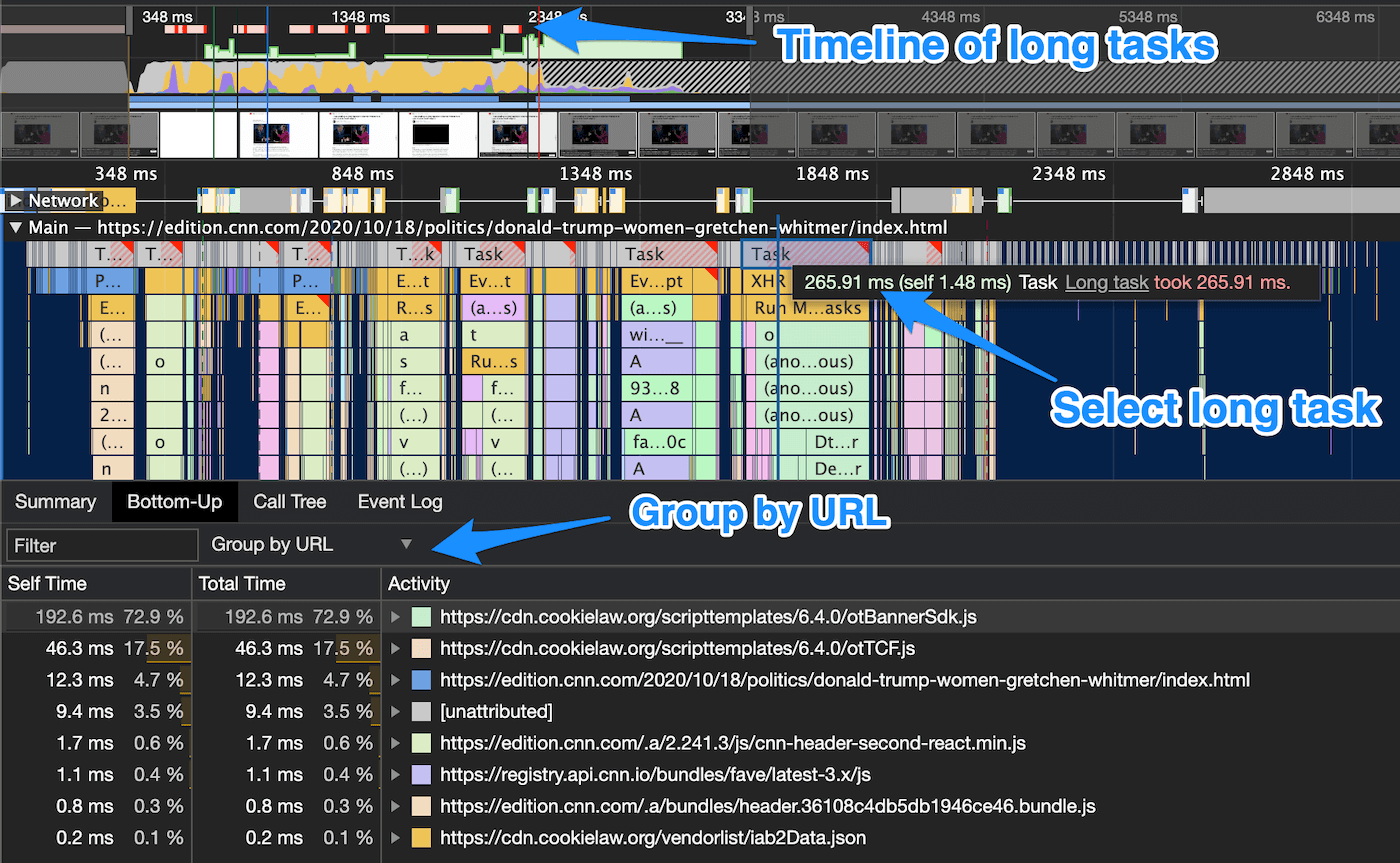
You can group the view by URL to quickly determine which scripts are causing the issues, in this case the cookielaw banner SDK is responsible for 200ms of 'self' time, meaning that the time was spent in this script rather than due to calls made by it. This could be due to the script itself being slow, or the implementation being poor resulting in multiple duplicated function calls. Time to start digging!
Another potential cause for high FID is the hydration process. If you have a server-side rendered single page application, the hydration process adds the client-side application functionality to your static HTML. Whilst this process results in a faster first render (and LCP), it may delay interactivity and increase the potential for delay when a user tries to interact. If you are using SSR with client-side hydration Addy has a brief write-up of the issue with a few resources on how to manage this performance gap.
Cumulative Layout Shift (CLS)
CLS is a measure of how stable the UI feels as the user loads and interacts with a page. It is a sum of unexpected layout shifts during the page lifecycle, like when an advertisement banner loads and pushes the main content of the page around.

Layout shift scores are derived from the impact the shift has on the viewport: a product of how much of the viewport changes and how far the element moves. A perfect cumulative score is zero, 0.1 is good. See the official documentation for more details.
Unexpected layout shifts mean that they do not occur immediately after a discrete user interaction, so it will likely have a negative impact on user experience.
CLS is measured by CrUX throughout the lifecycle of a page, from the start of the navigation right through to when the user leaves the page. All unexpected layout shifts are summed throughout this time and the total score is used for the measurement; this makes it a tricky metric to measure in a lab setting. This also means that tools such as WebPageTest and mPulse will report the best-case scenario for CLS, they will only collect this data whilst the page is loading and ignore further shifts such as those that occur during scroll.
Optimising CLS during page load is reasonably simple, we just need to prevent layout shifts! There are multiple causes for layout shifts, so let's look at some of the causes and how to prevent them occuring.
- Web fonts - match your web font character and line spacing to the fallback font
- Ads - pre-allocate layout slots for ads, use a fallback image if ads fail or are blocked
- Late-loading CSS - ensure layout-critical CSS is in the critical path
- Images - always add a width and height attribute for images, so the browser can allocate space before the image downloads
- Dynamic content - where possible, pre-allocate layout space for dynamic elements
Chrome's developer tools now has a handy method to identify what elements caused a layout shift, and how they contributed to your cumulative layout shift score
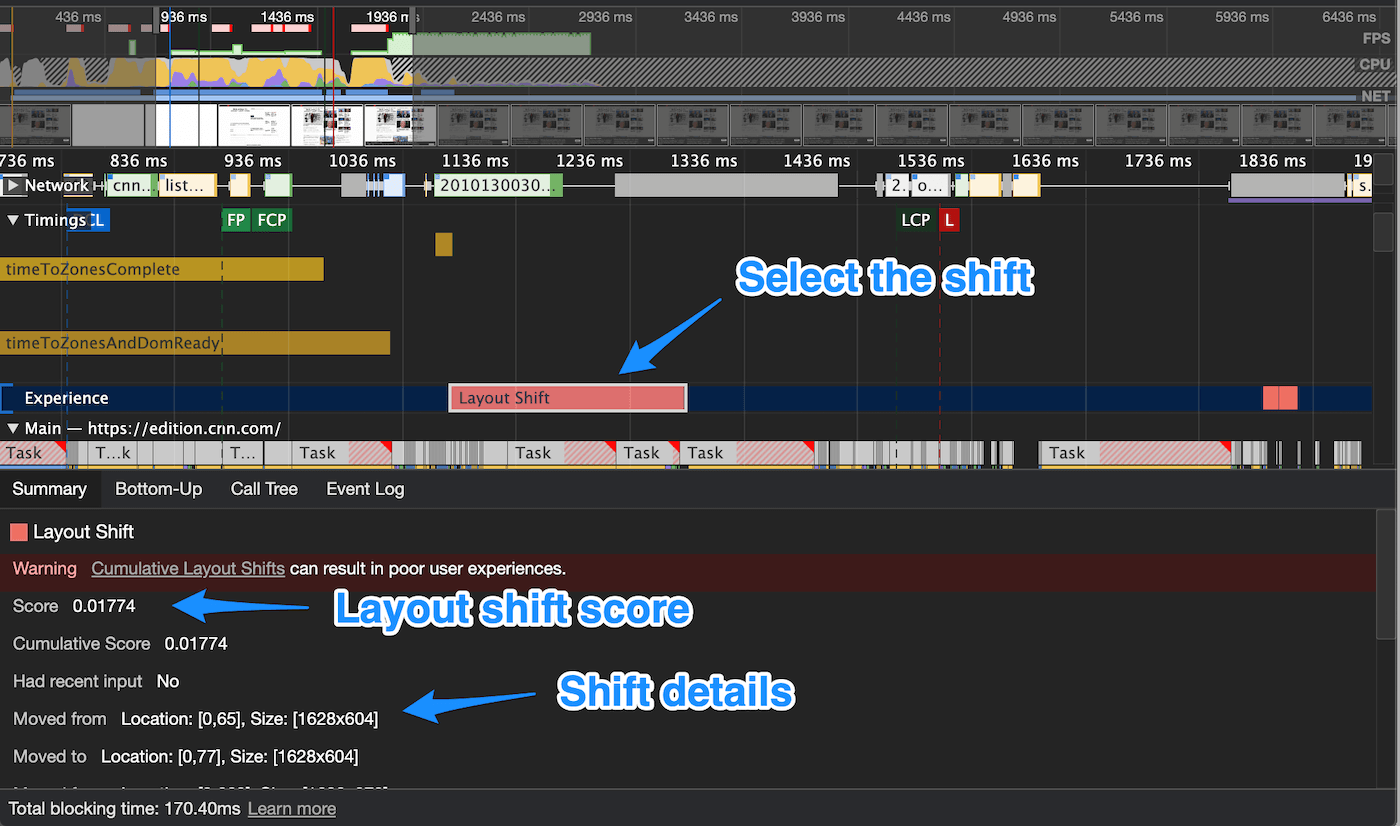
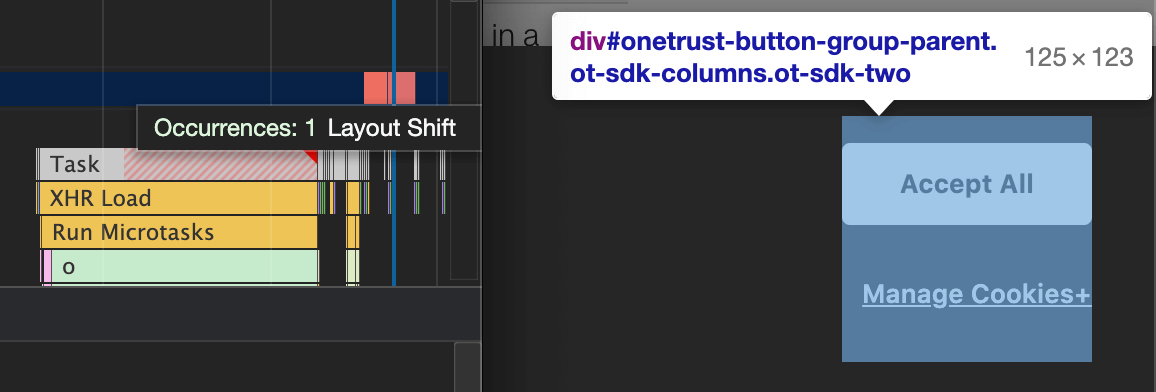
If you hover on the layout shift in the experience track, Chrome will highlight the element on the page. Note that the details show you where the element moved from and to.
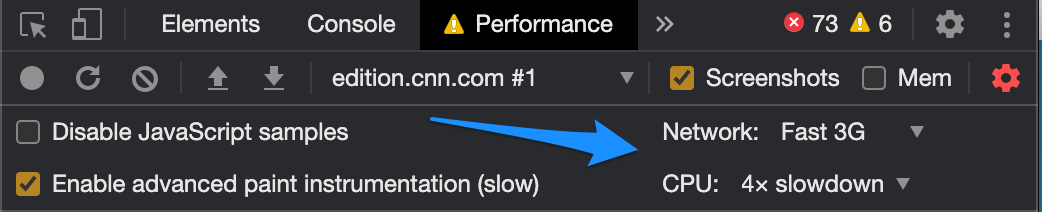
I recommend setting your network and CPU throttling options in the Performance tab, this makes it more likely that you will catch the layout shifts that happen in the wild due to network race conditions.
Once you've identified the elements that are causing layout shifts, it's time to determine how to reduce or prevent them.

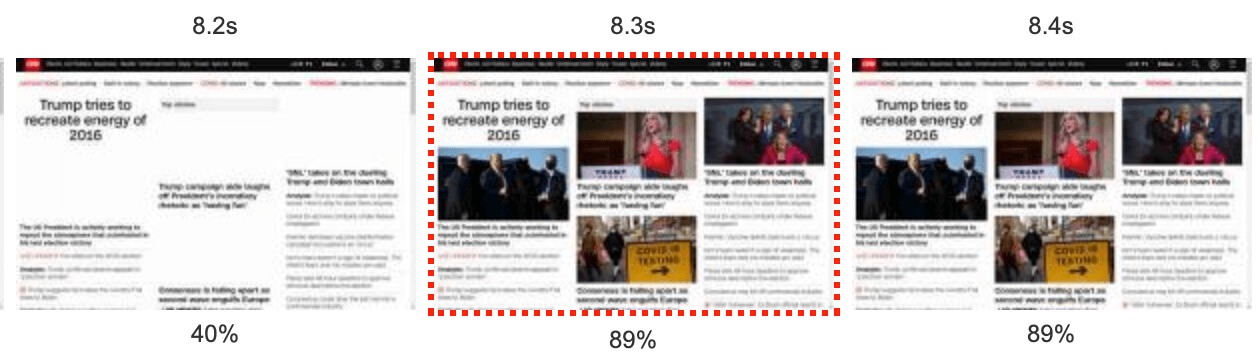
In this example from CNN, the headline element shifts multiple times during page load. The major shift is due to the author's image loading and pushing the byline to the right. Another shift is caused by the web font for the headline changing the headline layout. The image shift can be resolved simply by adding width and height attributes to the <img> element!
For the text element shift, the font-face has a font-display:swap descriptor (which is a good thing!) but the fallback font has a different character width to the web font. When the web font is loaded, the text element shifts as the characters are more condensed and the element is sized to fit the contents. In this case it is a small layout shift but the impact on body text can be much greater, as text overflow may cause the body element to resize. It might be possible to fix this by matching the system font to the web font, using font-face descriptors, but the most robust way to avoid font-based layout shifts is to preload the webfont and use font-display: optional. This combination gives the browser the best chance to have the webfont(s) available when it needs them, but lets the browser use the fallback font in case the webfont is not available. This ensures that there will be no layout shift due to fonts, both for the initial page load and subsequent page loads which will use the now cached webfont.
Other Vitals
Whilst the initial Page Experience update defines LCP, FID and CLS as the core web vitals, these may change over time! There are a host of other metrics which provide additional value and are worth tracking & optimising. Below are some more key metrics that you might want to track and improve.


First Contentful Paint (FCP)
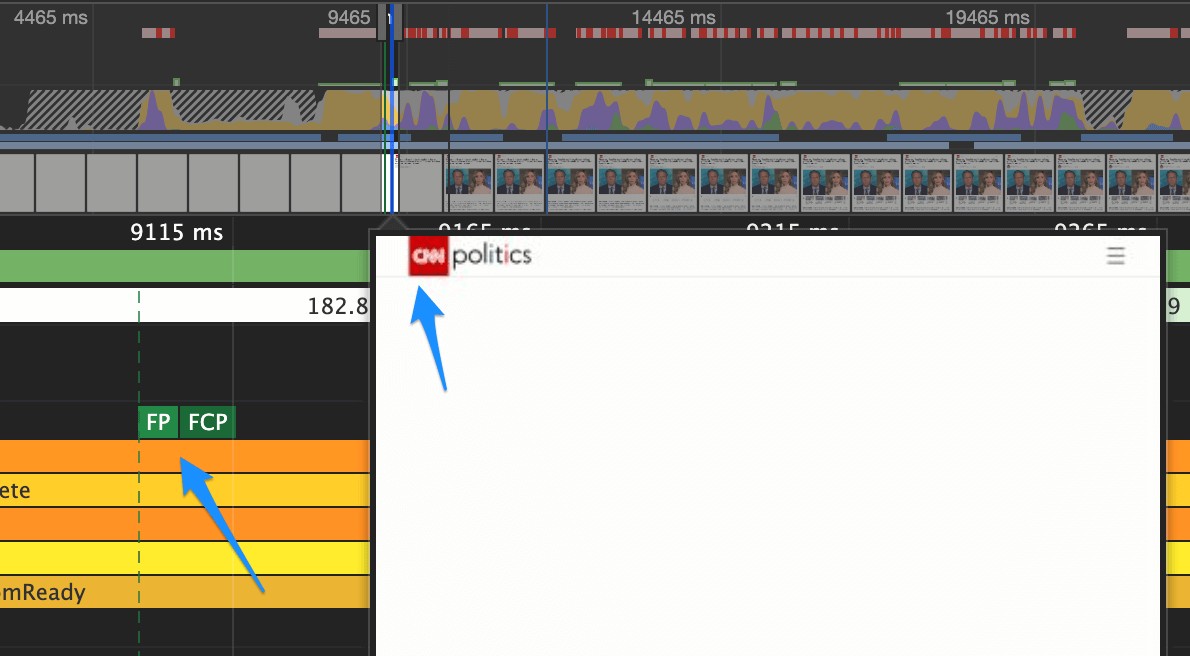
Whilst LCP measures the largest paint on the screen, FCP measures when the first paint occurs. This is an important metric for a number of reasons, not least that this is the first time a user knows that their navigation is actually working. This timing point will also correlate well with when the user's browser switches context from the previous page.
FCP is often identical to first paint, or very shortly after. First paint includes non-visible elements in the calculation, whereas FCP only measures content which is visible to the user. In this case, the site logo and header:
Time to Interactive (TTI)
Time to interactive (TTI) is an approximation of when the page will feel interactive if a user tries to interact. This timing point is measured between the First Contentful Paint and when main thread has been free of long tasks for at least five seconds. Getting this metric as low as possible will ensure that your users have a great experience when they try to interact with your pages. Use TTI with TBT to get an overall picture of how busy the browser is when loading your pages.
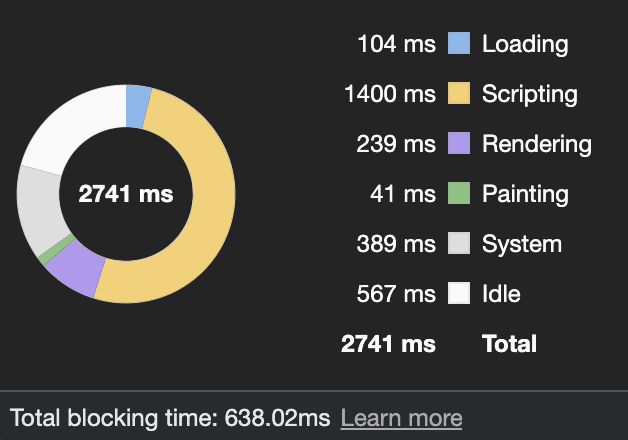
Total Blocking Time (TBT)
Total blocking time (TBT) is a measure of how busy the browser's CPU was while loading the page, measured as the sum of long tasks (less 50ms each) between FCP and TTI. Reducing this time will likely improve user experience and may help improve perceived performance too. Look for large long tasks in your JavaScript profiles and try to reduce, remove or delay them.
How to track performance
Google's tools such as PageSpeed Insights, Lighthouse and web.dev will all give you a measurement of your core web vitals. The 'field' data has some limitations though: the data is collected only from Google Chrome users who are opted in to anonymous usage statistics collection, and is aggregated monthly with a week or two delay. So if it's the first week of October, you may only have data from the whole month of August available.
If you want to track web vitals more closely, look into a real user measurement solution like Akamai mPulse. RUM tools can collect performance data from every browser that supports them and give you real time insight into how your performance is tracking. You can also quickly spot issues with specific pages or devices, making the data actionable.
Conclusion & Actions
The proposed page experience update will most likely occur in mid-2021. This will have an impact on SEO ranking as well as eligibility criteria for Top Stories in Google SERPs. Google has proposed three new performance metrics which will be used as signals for this SEO update, with selection based on their adjacency to user-perceived performance and the ability to collect the data in the field.
Optimising for these performance metrics, as measured by Google in CrUX, might have a positive impact on ranking in the future, but will certainly have a positive impact on user experience. We know that faster experiences lead to lower bounce rate, higher session length, better satisfaction scores, increased conversion, increased SEO traffic, increased revenue... So why wait?!
The great thing about performance optimisations is that many can be achieved with relatively minor tweaks to code, so go ahead and test your key pages, spot room for improvement and make positive change.