Installing InfluxDB & Grafana on Raspberry Pi
Step 0: Initial Setup
Follow these steps first if you have a brand new rPi:
-
Download the latest lite Raspbian image from raspberrypi.org
-
Get a reasonable micro SD card - 32GB is the maximum supported size. I use a SanDisk Ultra
-
Burn the image to your SD card, I recommend using balenaEtcher.
-
Balena will eject your SD card once it is complete, re-mount your card by physically removing and re-inserting it, then create an empty file called
sshin the root of the SD card - this enables SSH access which we'll need later. -
Insert the SD card into your Pi, connect to your router via ethernet and power on.
-
Determine the auto-assigned IP address of the Pi by logging in to your router interface (see a guide on finding your router IP address here) and navigating to LAN / DHCP settings - the pi should be recognised as
raspberrypi. Now is a good time to assign a static IP for your Pi to make life easier in the future. You'll need to power cycle your Pi if you change from the auto assigned IP address. -
SSH into the Pi using the IP address you have determined / assigned:
ssh pi@<yourip>. You should probably update the password for thepiuser now by runningpasswd. -
(optional!) put your Pi in a case to keep it safe and cool. I found a cheap (£6 / $8) case with heatsinks and fan on Amazon.
Step 1: Getting up to date
First off we'll make sure everything is up to date. This could take a while, especially on a new Pi:
sudo apt update
sudo apt upgrade -y
Step 2: Install Influxdb
First we add Influx repositories to apt:
wget -qO- https://repos.influxdata.com/influxdb.key | sudo apt-key add -
source /etc/os-release
echo "deb https://repos.influxdata.com/debian $(lsb_release -cs) stable" | sudo tee /etc/apt/sources.list.d/influxdb.list
Update apt with the new repos, & install.
sudo apt update && sudo apt install -y influxdbThen start the influxdb service and set it to run at boot:
sudo systemctl unmask influxdb.service
sudo systemctl start influxdb
sudo systemctl enable influxdb.service
We should now be able to run the influx client with influx and create a user for later (here I use a single admin user grafana for simplicity):
create database home
use home

create user grafana with password '<passwordhere>' with all privileges
grant all privileges on home to grafana

show users

user admin
---- -----
grafana true
That's it! You can now exit the Influx client by typing exit.
Step 3: Install Grafana
Again we need to add the Grafana packages to apt:
wget -q -O - https://packages.grafana.com/gpg.key | sudo apt-key add -
echo "deb https://packages.grafana.com/oss/deb stable main" | sudo tee /etc/apt/sources.list.d/grafana.list
We can now update and install the binaries:
sudo apt update && sudo apt install -y grafanaThen simply enable the service and set to run at boot:
sudo systemctl unmask grafana-server.service
sudo systemctl start grafana-server
sudo systemctl enable grafana-server.service
Now we can check that grafana is up by loading it in a browser: http://<ipaddress>:3000. If so, you can log in with the username and password = admin and set a new admin password.
Step 4: Add Influx as a Grafana data source
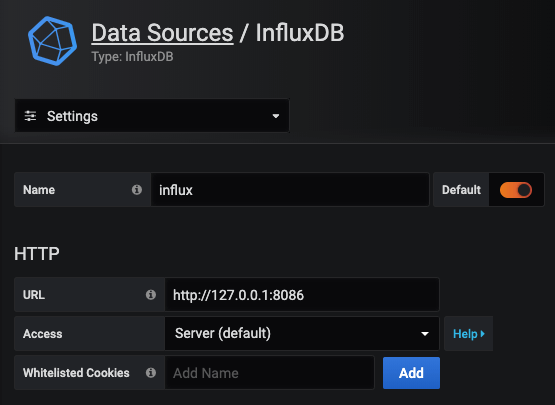
Now we have both Influx and Grafana running, we can stitch them together. Log in to your Grafana instance and head to "Data Sources". Select "Add new Data Source" and find InfluxDB under "Timeseries Databases".
As we are running both services on the same Pi, set the URL to localhost and use the default influx port of 8086:
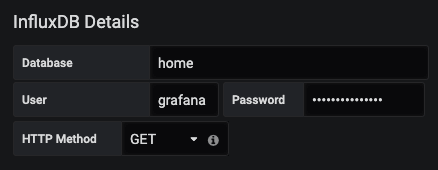
We then need to add the database, user and password that we set earlier:
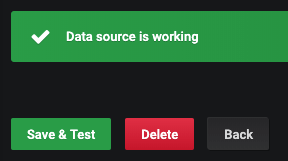
That's all we need! Now go ahead and hit "Save & Test" to connect everything together:
Step 5: Collecting some data
Now you've got your Influx & Grafana setup running, you can collect system stats, run regular network speed tests and collect data from your home automation system!