Reporting Raspberry Pi System Metrics to InfluxDB
Now that you've got your Pi set up with Influx & Grafana, it's time to start collecting some data! We will use a simple Python script to collect system statistics and push it to Influx - you can use this as-is or modify it to your needs.
We will need to first install the PIP package manager if it is not already on your Pi:
sudo apt install -y python-pipAnd then use pip to install the python packages psutil and influxdb:
sudo pip install psutil influxdbThe python script below will use psutil to collect some system stats and influx to insert them into your influx db:
#!/usr/bin/env python

import datetime
import psutil
from influxdb import InfluxDBClient

# influx configuration - edit these
ifuser = "grafana"
ifpass = "<yourpassword>"
ifdb   = "home"
ifhost = "127.0.0.1"
ifport = 8086
measurement_name = "system"

# take a timestamp for this measurement
time = datetime.datetime.utcnow()

# collect some stats from psutil
disk = psutil.disk_usage('/')
mem = psutil.virtual_memory()
load = psutil.getloadavg()

# format the data as a single measurement for influx
body = [
    {
        "measurement": measurement_name,
        "time": time,
        "fields": {
            "load_1": load[0],
            "load_5": load[1],
            "load_15": load[2],
            "disk_percent": disk.percent,
            "disk_free": disk.free,
            "disk_used": disk.used,
            "mem_percent": mem.percent,
            "mem_free": mem.free,
            "mem_used": mem.used
        }
    }
]

# connect to influx
ifclient = InfluxDBClient(ifhost,ifport,ifuser,ifpass,ifdb)

# write the measurement
ifclient.write_points(body)Create this script in your home directory, e.g. /home/pi/rpi-stats-influx.py and make the script executable with chmod +x rpi-stats-influx.py.
Test the script out by running it with ./rpi-stats-influx.py and check that no errors are thrown. If all is good, we can set the script to run reqularly using cron
Run crontab -e to edit your user's crontab and add an entry * * * * * /home/pi/rpi-stats-influx.py to the bottom of the file, this will run the script every minute. The script is very lightweight so running every minute should be fine.
See the docs for psutil to get ideas for other stats you can collect.
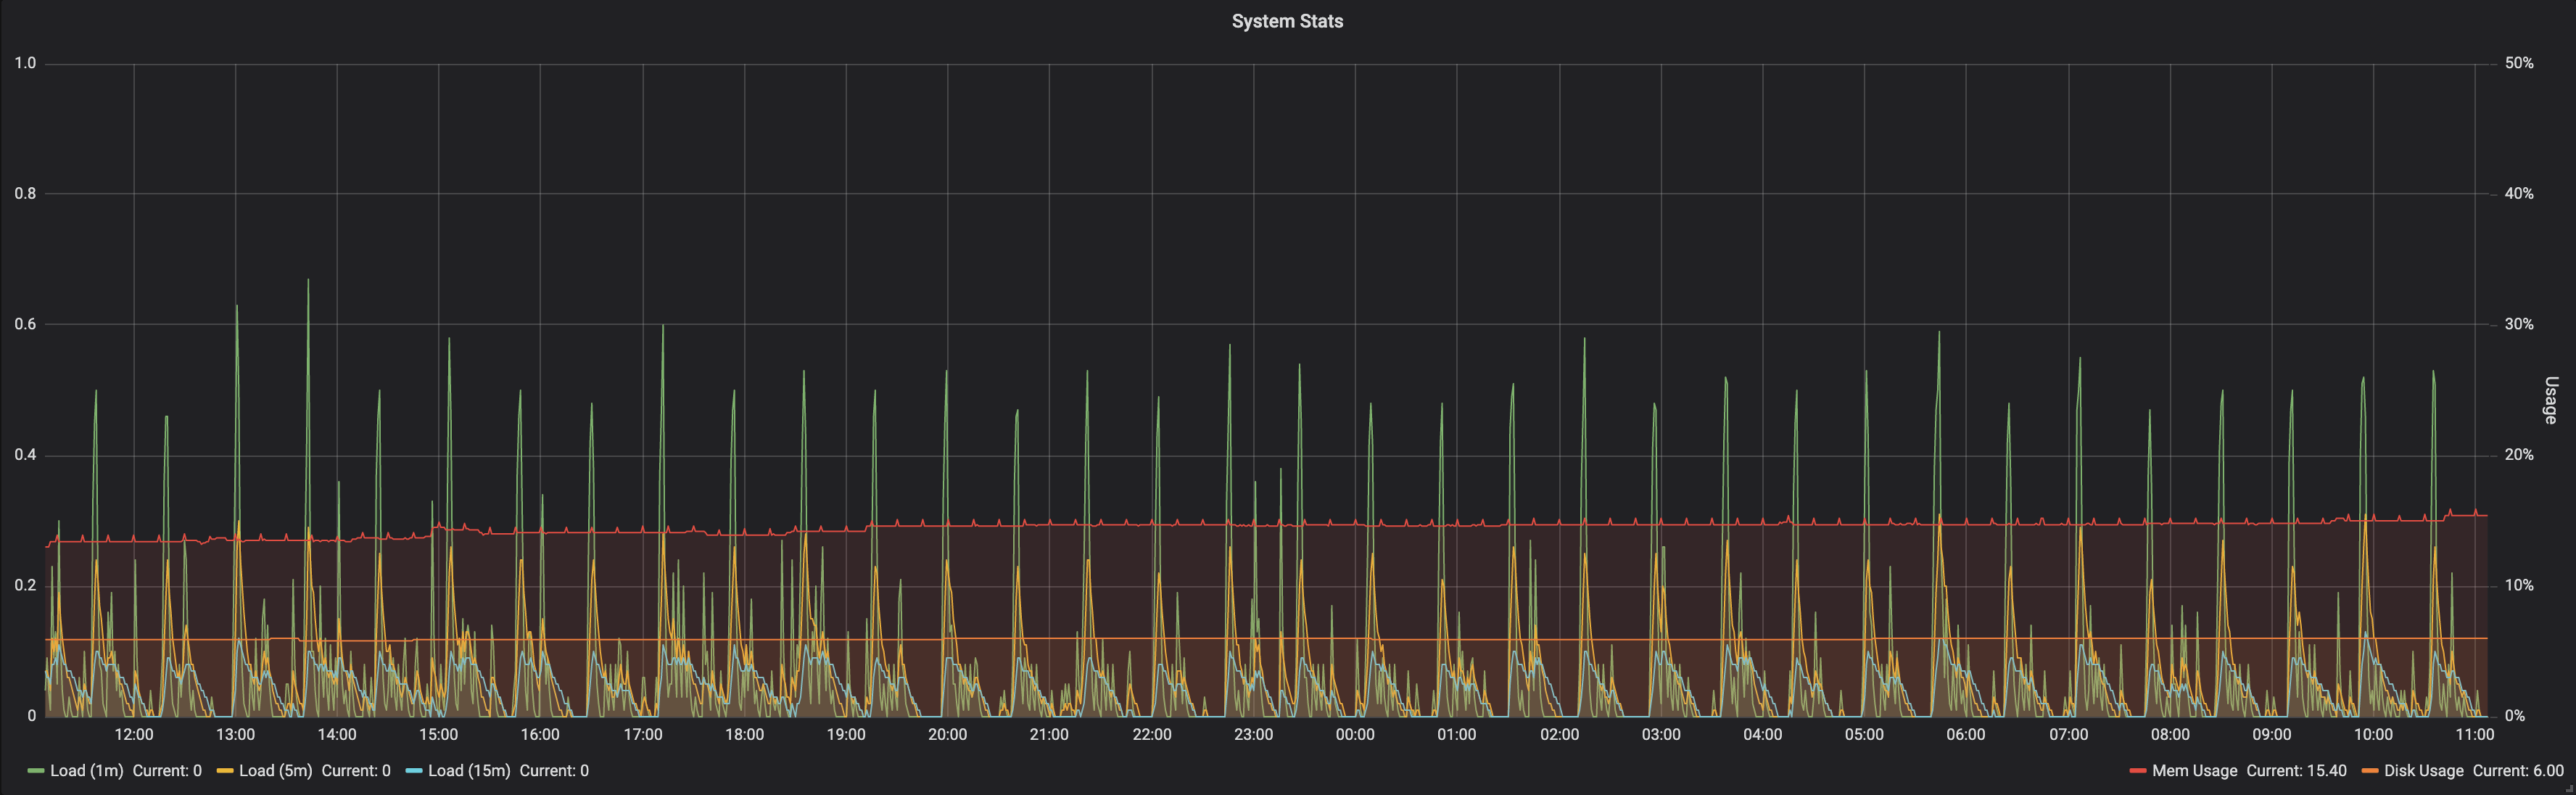
You can now simply add a panel to your Grafana instance to show your system stats over time. Here is a sample dashboard you can import which includes the panel shown below: