Collecting SmartThings data in InfluxDB on Raspberry Pi
Now that you've got your Pi set up with Influx & Grafana, you're collecting some system stats, and measuring network performance, it's time to collect data from SmartThings!
Samsung SmartThings is a multi-protocol smart home hub produced by Samsung, it supports Z-Wave, Zigbee and Bluetooth and is surprisingly configurable. One of my main frustrations with the service is the lack of visibility into the huge amounts of data that it collects, so I decided to store that data myself! This way I can query it and visualise it in Grafana, set alerts and get insight into how my home is performing.
Step 0: Set up InfluxDB and Grafana
This post assumes that you have an InfluxDB and Grafana server running already, take a look at my post on getting a Raspberry Pi configured if you need to get set up first.
Step 1: Adding the SmartApp
We need to install a SmartApp to SmartThings to collect the sensor data. This is a relatively straighforward process but is daunting the first time you do it.
- Log in to the IDE
- Navigate to the
My SmartAppssection - Click the blue
+ New SmartAppbutton in the top right of the screen - Select the
From Codetab - Copy and Paste the groovy code from influxdb-logger
- Hit
Create- you should see a green "Created SmartApp" banner - Click the
Publish -> For Mebutton to make the app available
Step 2: Configure the Logger
Now the SmartApp is enabled, you should see it in your SmartThings mobile application under SmartApps:
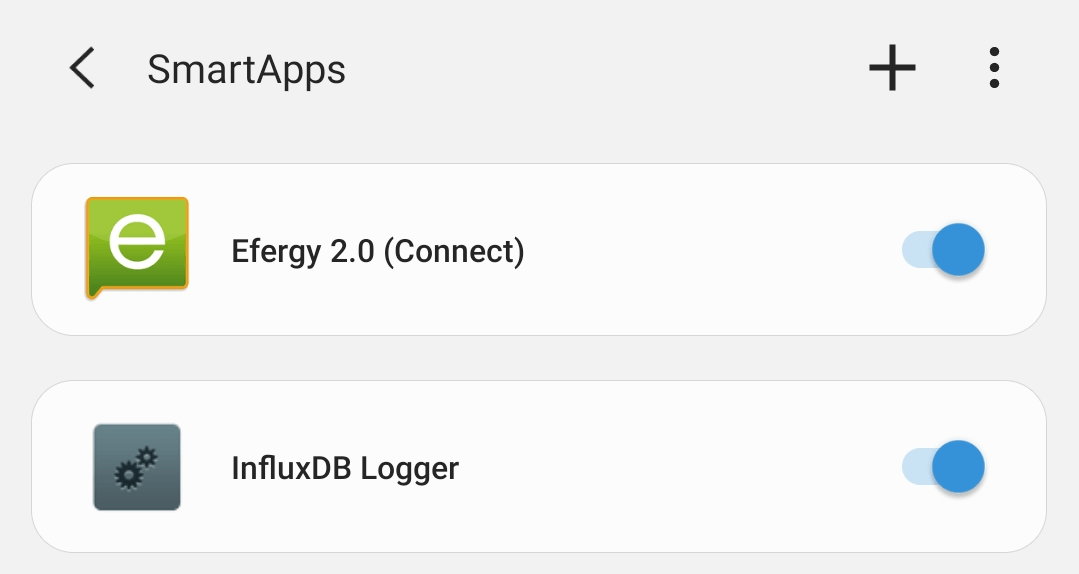
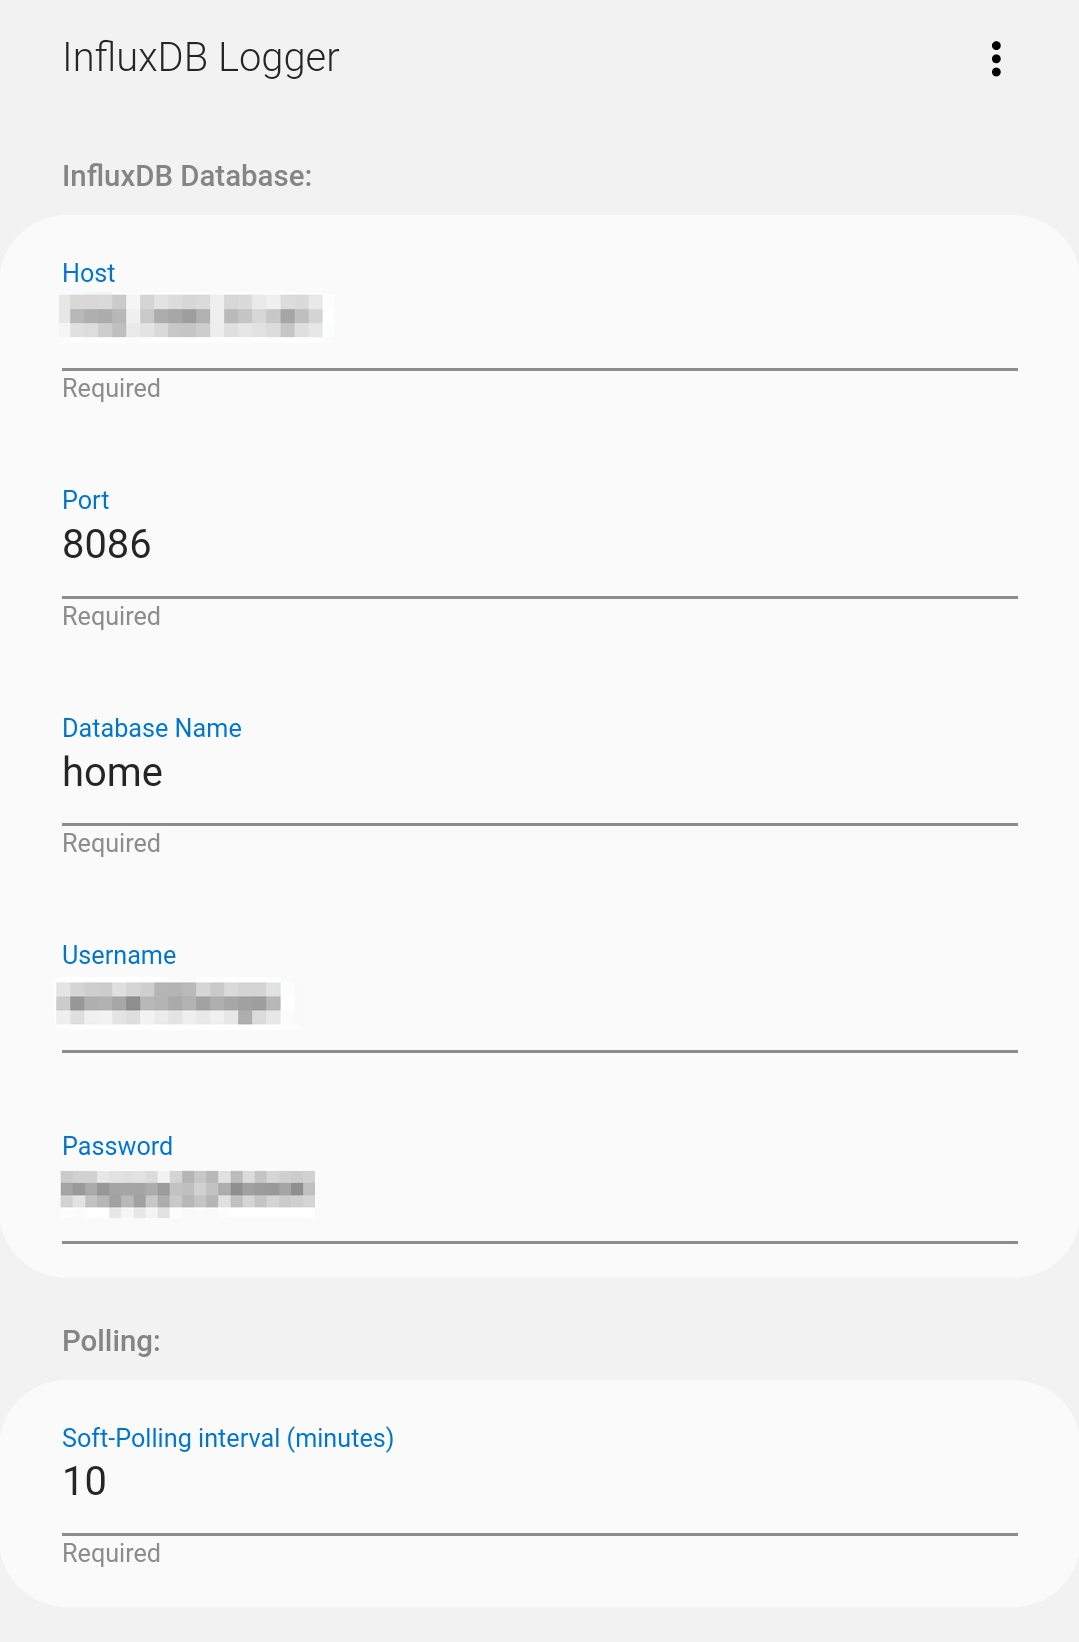
Click on the app to open the settings:
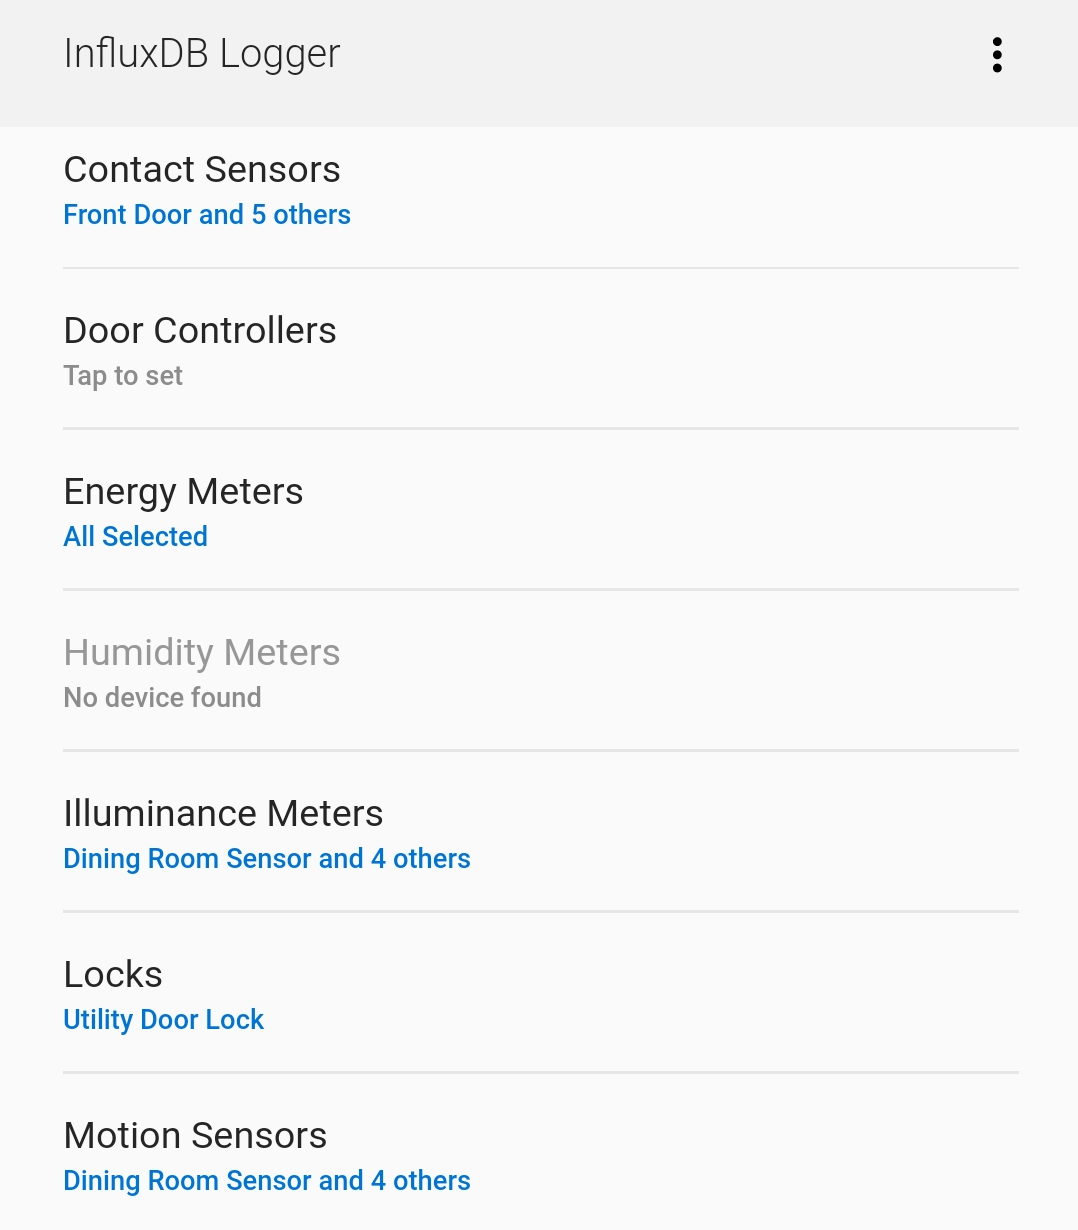
Select all devices which you would like to log:
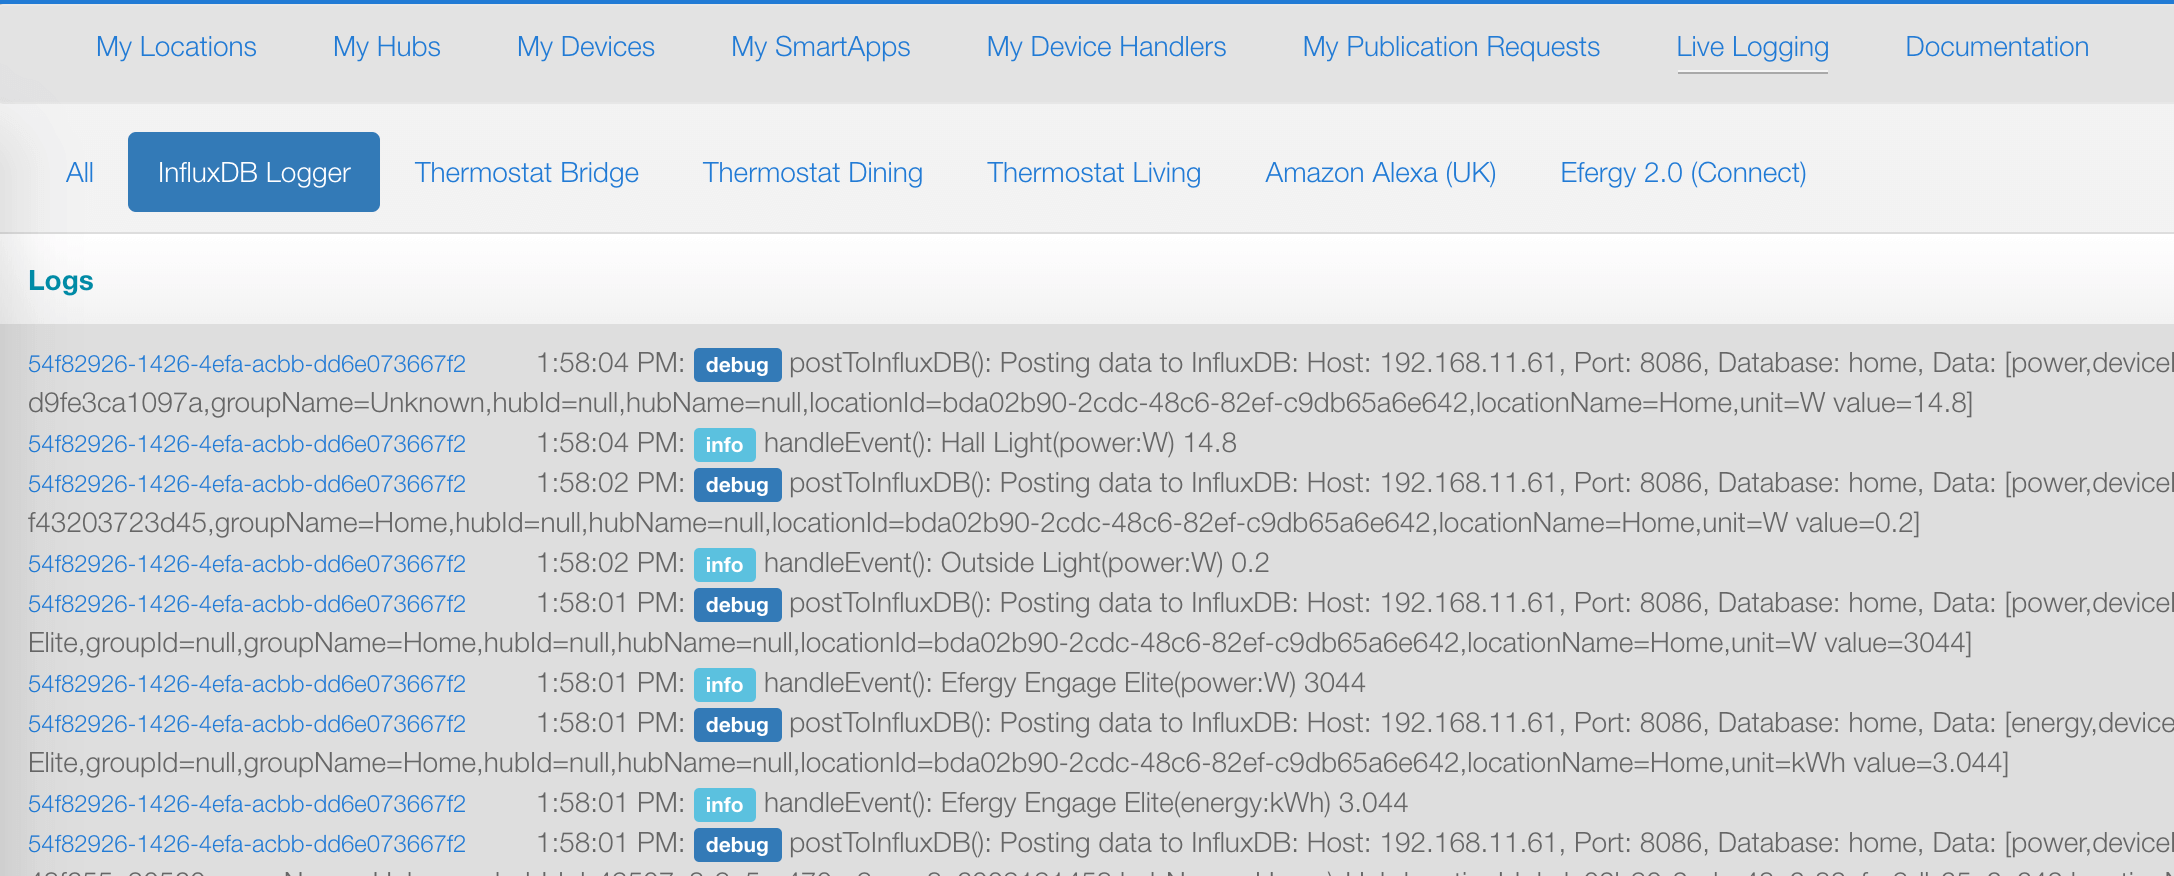
Save the settings and make sure that the app is enabled, you'll see data in your InfluxDB immediately if everything is working correctly. You can debug by viewing the live logs of your SmartThings location - click on Live Logging in the menu of the SmartThings IDE:
With any luck you'll have an InfluxDB filling up with device data!