Your Analytics Lies to You
The site speed fallacy
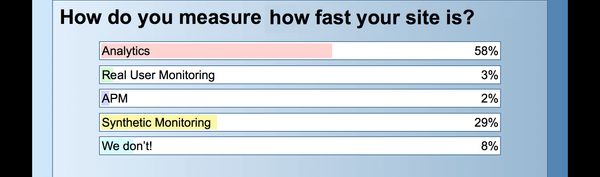
In a recent webinar, Andy Davies and I asked a poll of the attendees: where do you get your site speed data? Bear in mind that the majority of the attendees on the webinar were from Ecommerce or Digital Management. The results were just about what we were expecting, over half of attendees use web analytics to get their speed data:
Miss the webinar? You can watch the recording here
A further 29% of attendees use synthetic monitoring as their source of site speed data. While synthetic monitoring is great for measuring operational performance and tracking changes over time, it gives little indication of the real user experience. Only 2% of attendees stated that they use real user monitoring.
Using analytics for site speed is logical, if you have a website you will have analytics. Access to products like Google Analytics is widespread throughout an organisation, and it provides reporting on site speed data. Google Analytics (GA) is actually the best we've seen for reporting site speed. You can view multiple timing metrics and even segment by device type or location. Adobe Analytics has no default site speed data, you have to manually add it to the analytics code, once it's being collected there is very little you can do with it.
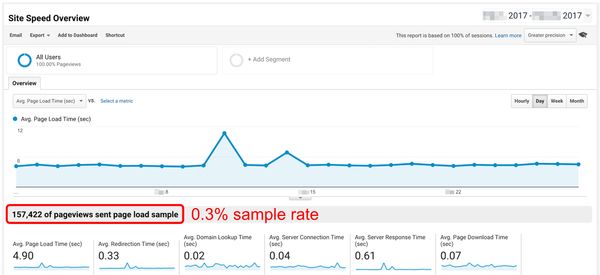
GA's site speed data is flawed. The data is sampled, limited by default to no more than 1% of pageviews even for Analytics 360 paid accounts. This sample rate can be changed to 100%, although that will dramatically skew your data towards traffic in the early hours of the morning, especially if your site attracts over 1M pageviews per day. Even if GA collected 100% of site speed data, it cannot be correlated with any other metric. The speed data is aggregated and averaged by time and not linked with sessions. As such it is impossible to determine the user experience of a whole session, or to correlate speed with goal completion.
ga('create', 'UA-XXXX-Y', {'siteSpeedSampleRate': 100});
Most of my job as a performance consultant is convincing companies that site speed is critical to their business, GA does not make that easy!
Phantom bounces
Anyway, so you've changed your sampling rate and got 100% of your pageviews sending site speed data. The average page load time is seven seconds, that seems pretty slow to you. Bounce rate is just over 50%, that seems pretty bad too. It's scary to think about it, but your bounce rate is likely much higher than 50%. Bounces are sessions which have only one pageview, it doesn't count sessions which have zero pageviews... Bear with me.
A recent study by Google compared DoubleClick and Google Analytics data to find that 53% of mobile ad clicks never result in a pageview, when the page has a load time of three seconds or more. Your analytics shows you that your mobile page load time is eight seconds, how many users who click on a link to your site never result in a pageview?
These non-pageviews are phantom bounces. They don't appear anywhere in your analytics, but they could be a significant proportion of your traffic. What's worse, your marketing budget is being spent on traffic which may never reach your landing pages.
Device representation
Most of my clients base their device testing strategy on their analytics. I vividly remember a story I was told by an employee at a large UK retailer: when first joining the mobile team as a contract resource she questioned why there was no testing on the first generation iPad. She was told that their analytics showed no traffic from such an old device (three years after it was launched) so there was no need to test on it. The sceptical contractor got out her very-much-still-working iPad 1 and loaded the homepage. Safari crashed. No analytics event was recorded.
This is a textbook case of the tail wagging the dog.
It is common for my clients to focus their attention on flagship devices from Apple and Samsung, "because all of our customers have them". Unfortunately your analytics is coming up short again. For one, GA will group all iPhone models into a homogenous 'iPhone' device; it does the same with iPads. How can you develop a solid device lab when you don't know which of the eleven iPhone models generate the most traffic?
Just because Apple and Samsung make up for 80% of your smartphone traffic, that doesn't mean that you can ignore the other 20%. As we've seen above, that 20% could be under-represented due to older devices failing to load your site at all.
Solutions
Right, that's enough of problems. How do we go about getting the right information?
Analytics
There's little that you can do to improve your analytics. With GA you can increase the site speed sample rate, but the data still doesn't have much value. It's the same with Adobe Analytics. Unfortunately I think it's necessary to separate performance and analytics products, even though they have a significant overlap. There's a niche waiting to be exploited! NCC's RUM solution has been designed to help build a business case for site speed improvements. I highly recommend a three week free trial.
Solving phantom bounces
Phantom bounces are an interesting challenge. From the DoubleClick study we know that there is a disparity between the clicks being logged and the pages being loaded. The flow goes something like this, assuming a click from Google's SERP:
- User clicks a link (actually loads a Google link)
- Google logs the click, redirects user to your site
- User's browser makes a request for your site
- Your site responds with some HTML
- HTML, CSS, JavaScript are processed
- Page loads
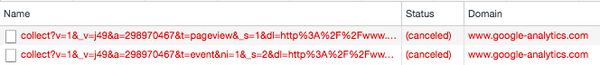
- Analytics beacon fires
Ideally, we would get data from the first step - how many people make the intention to load the page. This information is extremely hard to get, although an advertising provider should report on the number of clicks. If you have a good URL strategy then you might be able to do your own DoubleClick-style study, correlating ad clicks with pageviews.
It's also possible to correlate page requests with pageviews. Web server or CDN access logs can be compared against reported page impressions to determine the analytics loss. Further correlation can be run against the useragent of the requests to identify devices which are more underreported in analytics than others. I have seen loss rates around 20% before.
Better device representation
The homogenous 'iPhone' and 'iPad' issue can be solved pretty easily using WURFL.js. Simply instrument the JavaScript snippet on your site, integrate with GA and voila: iPhone and iPad models in your analytics.
Unless your website has a very specific audience, base your device testing on your target markets not your analytics. Amazon's best sellers list is usually a great place to start, bolt on the last 2.5 years of Apple and Samsung flagships, plus the Chinese upstarts OnePlus and Xiaomi, and you'll get reasonable coverage.
The top 12 devices should give you around 20% coverage of the whole smartphone market. You'll need 60 devices to get to 50%! Testing on the latest flagships should be a given, testing on the budget devices that make up around half of the market is the next step to take.
Get in touch via email or twitter if you need help getting better performance data, optimising your analytics configuration or setting up a device lab.