Getting Reliable Visual Performance Metrics
Visual metrics such as Speed Index, render start and visual complete are the best proxies we have for user experience. Unfortunately two of these are totally thrown by rotating carousels, popups, cookie banners and adverts.
To give an example, below is the homepage of Transport for London loading at Cable speed from London. It's clear that the main content of the page is visible by 6.5 seconds. The metrics we get from WebPageTest don't tally though, with visual complete coming in at almost 12 seconds.
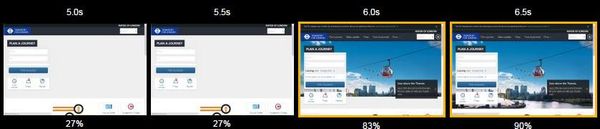
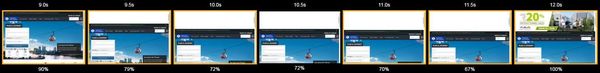
The reason that the WebPageTest metrics disagree with what we can see is that a few seconds after the 'first' visual complete, an advert appears which pushes content down the page. Notice that in the image above the visual completeness is reported at 90%. The image below shows what happens between 9 and 12 seconds.
This effect can be caused by a number of issues:
- Cookie banners which appear after the page loads
- Adverts which load late
- Carousels which auto-advance
- Auto-play videos
- Subscription popups
Unfortunately this is normally outside of my control as a consultant. It is an especially pertinent issue when I'm comparing multiple websites or pages, as some can appear artificially worse than others.
While I believe that anything which creates this effect is bad for user experience (e.g. rotating carousels), it's not my place to make recommendations on their use. So, we need a way to get reliable visual metrics given that a page under test can have one or more of these features.
When testing a page, WebPageTest has a default activity threshold of 2 seconds. That is: after all page activity stops, the test will continue for a further 2 seconds. If there is network activity within this time the timeout will reset. If the screen changes within this time, the final frame (after the timeout) will be used as the reference point for visually complete and Speed Index.
Thus, a potential way to improve visual metrics is to reduce this timeout. To do so in WebPageTest you can use a script, e.g.:
setActivityTimeout    100
navigate    http://tfl.gov.uk
The result is a page which finishes before the advert pushes content down, as shown below.
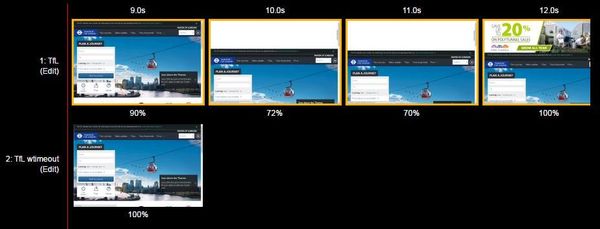
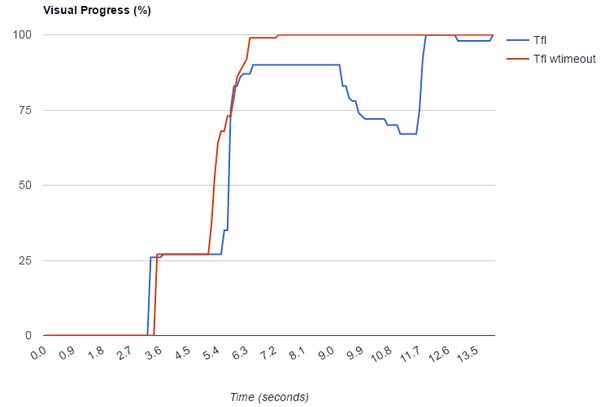
So if you want more reliable visual performance metrics, reduce the activity timeout threshold to something reasonable - like 100ms.
Unfortunately this can only be done through scripted sessions, or by changing the default in WebPageTest private as shown below.
/* PagetestBase.h */
#define ACTIVITY_TIMEOUT 2000
#define REQUEST_ACTIVITY_TIMEOUT 2000
#define FORCE_ACTIVITY_TIMEOUT 2000
#define DOC_TIMEOUT 2000