Blocking requests in webpagetest? Don't use Chrome.
Note: this issue has since been resolved by the Chrome team, please proceed with caution!
TL;DR: Blocking third-party requests in webpagetest shows you the impact they're having on a page, but Chrome is inefficient at blocking the requests. So use another browser such as Internet Explorer to do third-party impact testing.
In order to demonstrate the performance impact that third-party content can have, I like to remove the offending requests to show a before & after view of a web page. Nothing says 'your third-parties are harming user experience' quite like a video of a page loading twice as fast without them.
To do this, I run a test in webpagetest and get the list of domains as JSON. I parse this to filter out first- & second-party domains then re-run the test with all of the third-party domains blocked by webpagetest. Often, though, just blocking tag container(s) will do the job.
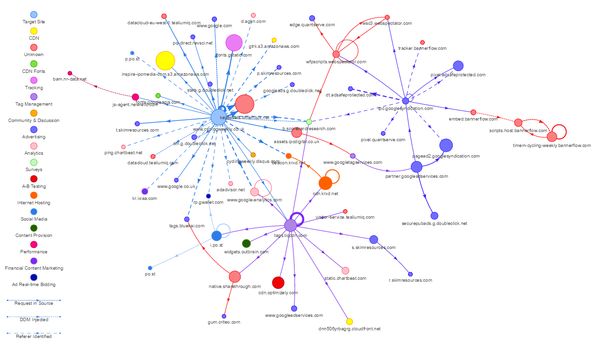
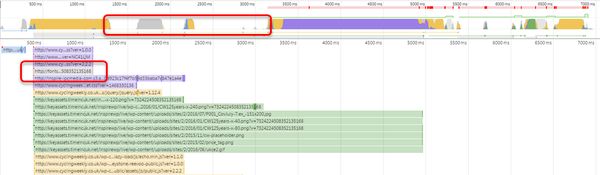
Let's take an example: cyclingweekly.co.uk. Not for any reason other than I like bikes. When you load the homepage, approximately 150 objects are loaded from 60 domains:
Now to test the impact of this large number of third-parties lets block them and re-run the test. Here's the result:

Kind of what I expected, the third-parties mean the page takes longer to finish. But I had secretly hoped that they were also affecting render performance - that the blocked version would render quicker.
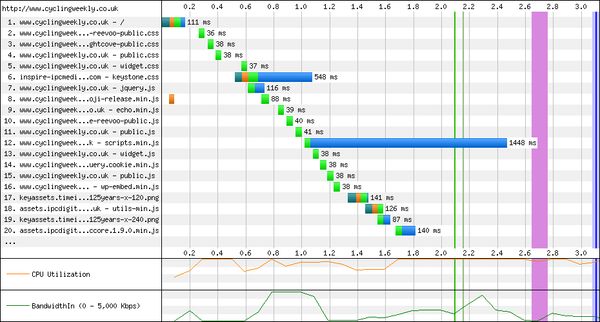
To dig in a bit deeper I looked at the waterfall chart of the blocked version, and I noticed two things: the requests seemed to be sequential rather than parallel, and the CPU was pegged at 100% for most of the time. Curious.
Whenever the CPU is pegged in a Chrome webpagetest result, here's a pro-tip: enable timeline capture.
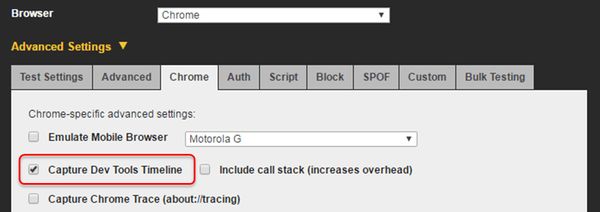
This gives you a json file that you can drag into your local Chrome developer tools window:
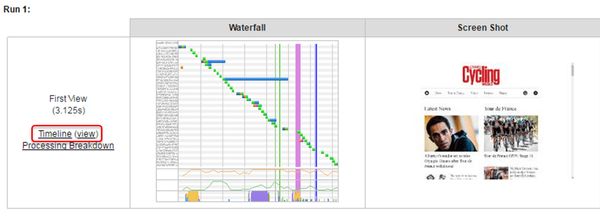
Loading this up in Chrome Canary lets you analyse the network waterfall in the timeline view, where I saw significant gaps in the processing timeline, and a number of grey requests:
The grey request was one which should have been blocked by webpagetest. You can't drill into any more details from this view, although it looks like the blocked requests still consume time yet don't have a response.
In issue 584 on the webpagetest GitHub repo Pat Meenan states:
blocking (or modifying request headers) in Chrome is exceedingly expensive
So, trying again in Firefox and Internet Explorer we get the following results:
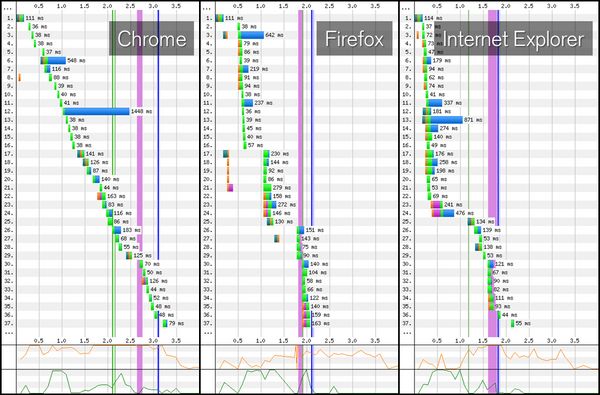
And for visual performance, IE gives the best result:

So the final result, to show the impact of third-party content on the user experience comes out below:
