How to Find the Third-Parties on Your Site
My customers often ask how a third-party asset got on their site. A director of digital once told me that Facebook was not on their site, not at all.
I ran the homepage through WebPageTest and sure enough, there were a bunch of calls to various subdomains of facebook.com. Thankfully WebPageTest stores initiator, referer and redirect headers; so with a little work you can find out where these third-party calls come from. The director was correct, there were no calls to Facebook on their site. It was a third-party creating fourth-party calls to Facebook! This can have serious ramifications if the Facebook (or any other third-party call) affects customer experience. Radware explain this well in an article from 2011
Trawling through the initiators and referers was a headache so I wrote a tool to do it: requestmap.webperf.tools
The request map runs a test in Chrome on public WebPageTest and uses the initiator, referer and redirect data to work out where every request comes from. Here's the result when you run Google.co.uk through the tool: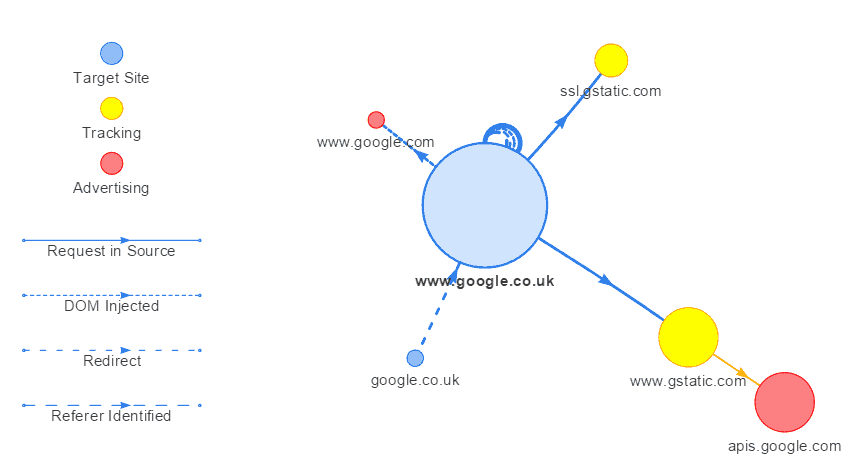
From the picture I can see immediately that the bulk of the content on the page comes from www.google.co.uk (size of blob is proportional to percentage of total bytes). There is a redirect from google.co.uk -> www.google.co.uk and a number of requests from other Google-owned domains.
It all looks pretty simple on Google.co.uk, there's basically nothing on it. But when it comes to an ecommerce site or a site generating advertising revenue, third-parties are everywhere. Whether they are for analytics, advertising, tracking, attribution... third-parties make people money. As such, they tend to be added to sites without much consideration for management of the relationship, the technology and (dare I say it) third-party SLAs.
Take the answers.com homepage as an example:
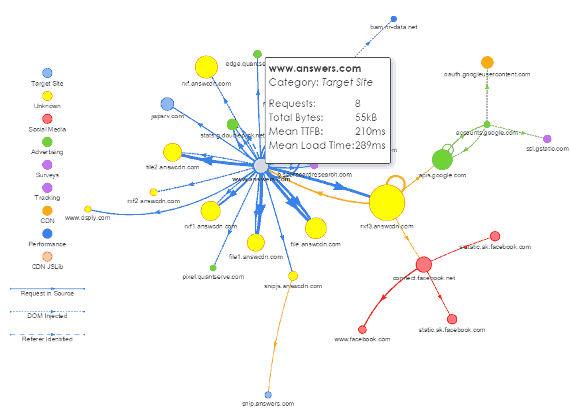
Here you can see that the root domain (www.answers.com) makes up a small proportion of the total page weight. This site uses domain sharding across a number of CDN domains (in yellow) to maximise performance for high-bandwidth customers. One CDN subdomain stands out from the others though: rxf3.answcdn.com is the big yellow blob on the right. Almost 500kB of content comes from this domain but, more interestingly, it initiates calls to Google and Facebook which then spawn requests to another six domains!
Another observation is based on the length of the edges on the map (the lines which join the blobs), these are proportional to the mean response time of that domain. Blobs that are far away from the target site on the map are far away from the customer's experience. A single asset from www.dsply.com (far left) took over 1.1s to load less than one kilobyte of content! It also took almost a second to load two kilobytes from snip.answers.com. Are these assets critical to the user experience? If so, there's a massive performance hit here.
There's a lot of work to do on analysing third-party components but visualising who is on your site (and how they got there) is a good start!