When Network is Faster than Cache
Introduction
I recently discovered that Firefox introduced a feature called RCWN (Race Cache With Network) in 2017. This feature was intended to improve web performance by racing cached requests against the network.
This seemed odd to me, surely using a cached response would always be faster than making the whole request again! Well it turns out that in some cases, the network is faster than the cache. There is some discussion on mailing lists way back in 2016 about the performance differences between browsers. "Firefox cache is performing better than Chrome on windows. Almost 25% fewer >1 second loads" reads one forum. More recently, someone mentioned on the Web Performance Slack that they had seen their cache take over three seconds to retrieve an object! This led me down a bit of a rabbit hole investigating cached responses:
The data in the mailing groups was relatively sparse and tended to focus on a specific browser, so I wondered if I could use mPulse to build a bigger picture. mPulse collects resource timing data from every visit to a client's website using the Resource Timing API. It is possible to determine if a resource was served from cache using a simple filter when querying the data: bool resourceFromCache = (transferredSize == 0 && encodedSize > 0). This filter sets a boolean of whether the resource was fetched from cache, based on the resource having a file size, but no network download. This allows us to group aggregated resource timing data by whether it was served from cache or network.
Responses to conditional GET requests (if-not-modified and if-modified-since) will be excluded from this data, as the transferred size is greater than zero due to the presence of response headers.
So why would a cached response take so long to fetch? Well the answer, frustratingly, is a bit of a shrug. There have been bugs in Chromium with request prioritisation, where cached resources were delayed while the browser fetched higher priority requests over the network. There is also the obvious cost of fetching the resource from memory. It is fair to assume that the memory cache at a CDN or ISP proxy server is higher performance than the average mobile device, and the cost of an additional request over an H/2 connection on a good connection is negligible. For desktop devices, reading from disk may have a significant cost compared to a multi-megabit wired network connection. This comment from one of the firefox bugs raised on RCWN shows a desktop user with 1.3% successful network race. While the bug is complaining that the races are too frequent, I'm surprised that they win at all!
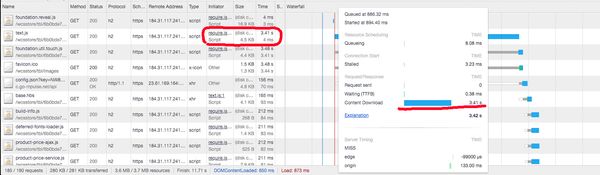
On my OSX box I'm seeing us race more than we probably need to:
Total network request count: 5574 Cache won count 938 Net won count 13
That's racing almost 16% of the time, but only winning 1.3% of the time. We should probably back off on racing a bit in this case, at least. Tune RCWN racing parameters (and make them pref-able)
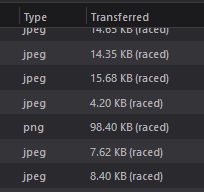
This strange phenomenon will also mean that you could see your browser making fetches for cached immutable assets! This was recently noticed by Eric Lawrence of Fiddler fame:
Firefox 78 periodically refetching "immutable" resources: pic.twitter.com/0UtRiSSpvf
— Eric Lawrence 🎻 (@ericlaw) May 5, 2020
This all led me to dig into some data at scale and see if there are any interesting patterns we can use, and what we can do about it! I'll be looking at cache retrieval time, which I define as the time between request start and response end, for a resource served from cache.
The results show that cache retrieval performance is impacted most by two factors:
- Device hardware
- Total number of assets served from cache
Read on to learn about the methodology for collecting the data, or skip straight to the results.
Data Collection
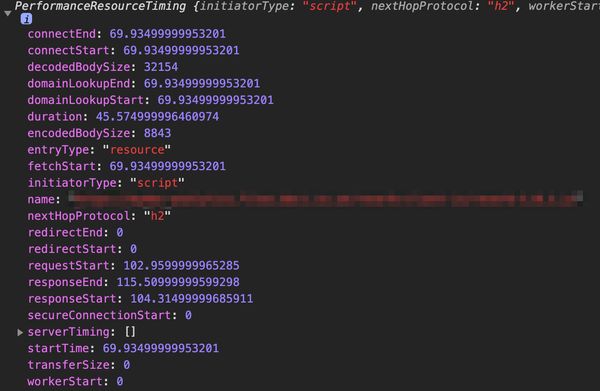
All data used in this analysis is collected using the open source library Boomerang. Boomerang is the jQuery of performance measurement in the browser, smoothing over the cracks in browser APIs to provide a consistent source of performance data back to ancient versions of IE. To take a look at the data available in your browser run the following in your developer console:
window.performance.getEntriesByType['resource'](0)This will expose the resource timing data for the first object in the current page (excluding the HTML document - that's in the Navigation Timing API data).
Boomerang will then compress this data using a clever trie algorithm and send it to a collector, for every pageview. mPulse is an enterprise solution to manage this process, collect and store the data and provide dashboards and alerts. Resource Timing data is stored for 14 days, so I have two weeks of data to analyse at any time. Along with the timing information, mPulse stores a large amount of data about the device which made the request - including manufacturer, available memory, battery state, network state and more! All of this depends on the data being available to JavaScript, so it is not guaranteed across platforms.
Limitations
There are a number of limitations to data collected from the browser (field data).
- Timing-Allow-Origin - resource timing information is not available for cross-origin domains, unless the host opts in by setting a
timing-allow-originheader. This means that we lose data for approximately 70% of third-party requests. These are rarely cacheable, and it is not a problem that we can fix, so it is ignored. - Resource Timing Support - RT is reasonably well supported at the time of writing, but we do miss Opera browser entirely.
- Late Loaded Resources - Boomerang collects data for resources which occur before the beacon is fired, this is typically at window loaded. As such we do not have data for resources loaded later in the page lifecycle.
- Size of Data - There could easily be billions of data points for a query across all resource timing data, I tended to narrow down my queries to a minimum of a 24hr time window and use basic data hygeine to exclude bad results.
- Non-direct Comparison - It is not trivial to compare directly a cache miss and a cache hit in large-scale RUM data, as this would require a comparison at almost the individual device level. We are using aggregates here to look at general performance rather than a direct comparison of cache vs. network.
Results
I wanted to find out if there were any common dimensions which will lead to a slow cache retrieval time. We saw earlier that Firefox might be faster than Chrome, but what about small vs. large resources, scripts vs. images, mobile vs. desktop?
You could simply compare statistics on this data, but where's the fun in that? You will find a set of distributions in the following sections, each distribution shows the performance of cache retrieval by the given dimension. Sharp peaks to the left indicate fast and consistent retrieval times, broad and low charts indicate slow and variable retrieval times.
The mailing lists (and the complaint on Slack) showed retrieval times that took multiple seconds. In the data I see this happen extremely infrequently, so instead I focus on retrievals in the time range ≤250ms to spot differences across the dimensions. You can change the scale of both axes using one of the sliders below the charts. There is also a checkbox to show cache miss results (i.e. requests that go to the network), we can expect these to normally be quite slow so the relative height of the chart will be small.
By Resource Size
My first hypothesis was that there might be a correlation between resource size and cache retrieval duration. It makes sense that it would take longer to retrieve an 800kB image from cache than a 10kB one. Well, it turns out that cache performance is pretty consistent across resource sizes. Once you get to 100kB - 1MB the retrieval times take a slight (<1ms) dip, but overall not a huge shift.
By Resource Type
My second hypothesis was that browsers might treat different resources differently, a cached CSS asset should be a higher priority than a cached image one might assume. Again, there is no real correlation here.
By Browser
Now we're getting to the good stuff, do different browsers perform differently? My hypothesis was that we would see a difference between browsers used on mobile and desktop devices. We see that this is true, for some browsers!
Desktop Chrome has a much more consistent cache retrieval time than Chrome Mobile, with Samsung Internet showing a really broad distribution. On the other hand, Mobile Safari appears to perform better than desktop Safari - indicative of Apple's continued investment into mobile hardware.
By Operating System
Ok but Browsers are installed across lots of different devices, what if we broke this down to Operating Systems? Here we're starting to get some interesting data. Desktop Operating Systems perform better than mobile, and Android performs worse than iOS. This makes sense, Apple controls the hardware on which iOS runs, whereas Android (through the Android Open Source Project) could be running on anything from a $25 feature phone right up to a $1,000+ flagship.
By Manufacturer
Let's dig down a bit further and look at the performance for actual devices. Here we see a bubble plot including the device type, operating system and reported device manufacturer. You will notice that the vast majority of bubbles are Android - this is due to a combination of two factors:
- Desktop devices generally do not advertise manufacturer in the User Agent String
- Android has, by far, the greatest manufacturer diversity of all Operating Systems
I've highlighted on the chart those devices which have an median cache retrieval time of >100ms. This is per resource, user experiences on these devices are likely to suck. On the other end of the spectrum, high-end manufacturers such as RED, Razer & Apple demonstrate consistently fast retrieval times, with a median <8ms.
A Bit Deeper
I decided to make some focussed queries in order to get a more definitive picture of cache retrieval performance. The most obvious thing to do is track down a single cacheable asset and focus on that. A quick look at the data shows the most common resource is, unsurprisingly, Google Analytics: analytics.js.
Unfortunately the Google Analytics JS is not sent with a timing-allow-origin header. As such, we cannot tell if it was delivered from cache or not 😔 I modified my search to only include resources which were both cacheable and had the timing-allow-origin header. The top result was again from Google, this time their ad tracking script: conversion_async.js.
This chart shows the retrieval times for conversion_async.js by manufacturer. Try reducing the y-scale to see the cache misses appear on the charts, note that the long-tail of the cache hits overlaps well into the cache miss performance. This shows how often cache performance is worse than network, and how consistently fast Apple devices are.
The Obvious Bottleneck
I received a comment from Uwe shortly after publishing this post which got me thinking:
Thank you for this piece of research.
— Uwe Trenkner (@utrenkner) May 8, 2020
If resource size does not correlate much with hit/miss, we are back in HTTP/1 times, where the number of requests is crucial: Concatenate scripts and style sheets as much as possible to avoid requests - not only over the network.
Earlier in the post I mentioned that there was a Chromium bug where network requests might block cache requests. Taking that idea a little further: what if our optimisations on the network stack such as HTTP/2 Request Multiplexing have degraded the performance of cache retrieval? File concatenation is generally considered an anti-pattern in H/2, but how do device caches handle concurrent reads?
It turns out that there is indeed a strong correlation between the number of resources retrieved from cache and the average retrieval time! This holds especially true for Android & Chrome OS devices. For example: Chrome OS average cache retrieval doubles from ~50ms with five cached resources up to ~100ms with 25 resources.
This data is from a large dataset, but still shows some variance due to the potentially small dimension set sizes such as less popular operating systems. The data shown is only for page loads that had between 1 and 250 assets retrieved from cache. Data points are only included if there were at least 100 occurrences of the combined dimensions (operating system, device type & number of cached resources).
It turns out that Chrome actively throttles requests, including those to cached resources, to reduce I/O contention. This generally improves performance, but will mean that pages with a large number of cached resources will see a slower retrieval time for each resource.
The short-term proposal is to throttle H2+QUIC requests just as we do for HTTP/1.1 requests today. This ensures that a started request will have to wait for no more than 9 other requests, reducing the TTFB delay for the first request from 400ms to 40ms. Doing so shows an average 25% reduced time-to-first-contentful-paint (TTFCP) for a cached https://android.com.
So What
I was intrigued to dig into this data after reading about browsers racing cache vs. network and I enjoyed pulling data and plotting the charts. But what can we as humble developers actually do with this information?
The Digital Divide Grows Wider
It turns out that this reinforces a well known but oft-ignored fact: folks on the lower end of the social scale have a worse web browsing experience. We know that cheap devices will have slower processors, less memory and lower bandwidth, and that this leads to a worse perceived page speed. Now we know that even cached experiences are slow for these users. This spreads our concept of a digital speed divide even wider. We also know a little more about browser internals!
The best thing we can do to deliver an inclusive web is to deliver the minimal viable experience, especially to low-end devices. This will benefit all users.
Cache Will Not Save Us
There is an assumption that cached assets are retrieved instantly and at zero cost. What we have discovered here is that there is in fact a cost to retrieving assets from cache based on the number of cached assets (not file size) and the user's devices. Concatenating / bundling your assets is probably still a good practice, even on H/2 connections. Obviously this comes on balance with cache eviction costs and splitting pre- and post-load bundles. Make sure you test performance on real devices, and definitely start tracking repeat-view performance of changes you make to bundling and cache configuration!
If nothing else, you might remember this the next time you're stumped by some strange cache behaviour 🙂
Let me know by interacting below if you have any thoughts on cache performance, or if you have ideas on other interesting dimensions to drill in to!